IMAGE

Fig. 2

ID
ZDB-IMAGE-211011-25
Source
Figures for Ellingsen et al., 2021
Image
Figure Caption

Fig. 2

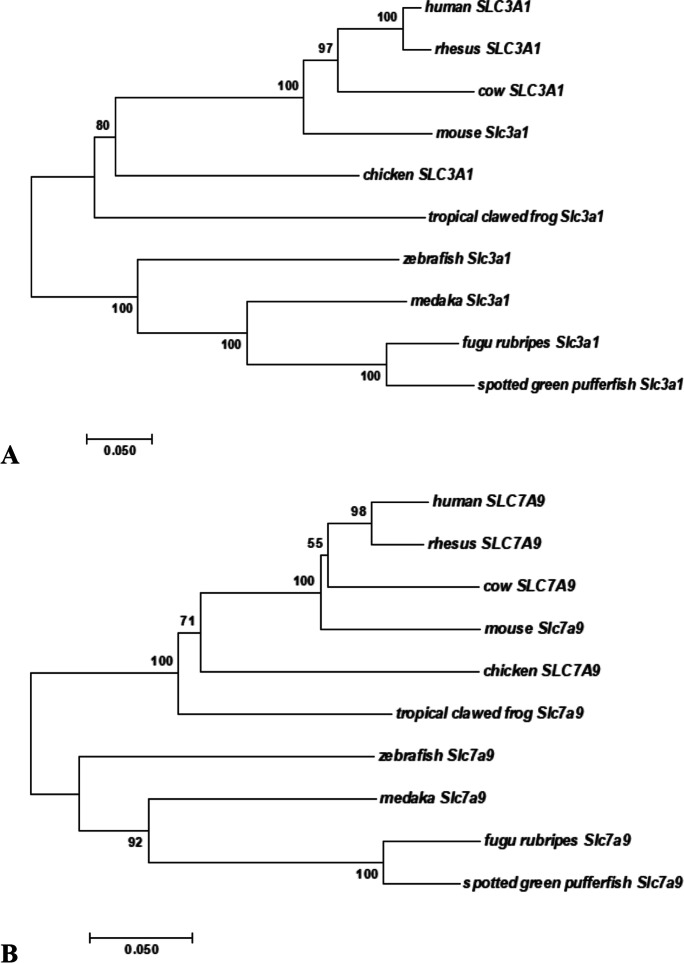
Evolutionary relationships of taxa for Slc3a1 and Slc7a9. The evolutionary history was inferred using the Neighbor-Joining method (Saitou and Nei 1987). An optimal tree with sum of branch length = 1.67110532 is shown. The percentage of replicate trees in which the associated taxa clustered together in the bootstrap test (1000 replicates) are shown next to the branches (Felsenstein 1985). The tree is drawn to scale, with branch lengths in the same units as those of the evolutionary distances used to infer the phylogenetic tree. The evolutionary distances were computed using the Poisson correction method (Zuckerkandl and Pauling 1965) and are in the units of the number of amino acid substitutions per site. The analysis involved 10 amino acid sequences. All positions containing gaps and missing data were eliminated. There were a total of 599 positions for Slc3a1 (A) and 471 positions for Slc7a9 (B) in the final dataset. Evolutionary analyses were conducted in MEGA7 (Kumar et al. 2016)

Acknowledgments
This image is the copyrighted work of the attributed author or publisher, and ZFIN has permission only to display this image to its users. Additional permissions should be obtained from the applicable author or publisher of the image. Full text @ Fish Physiol. Biochem.