
Figure 6.
- ID
- ZDB-IMAGE-210911-45
- Antibodies
- Publication
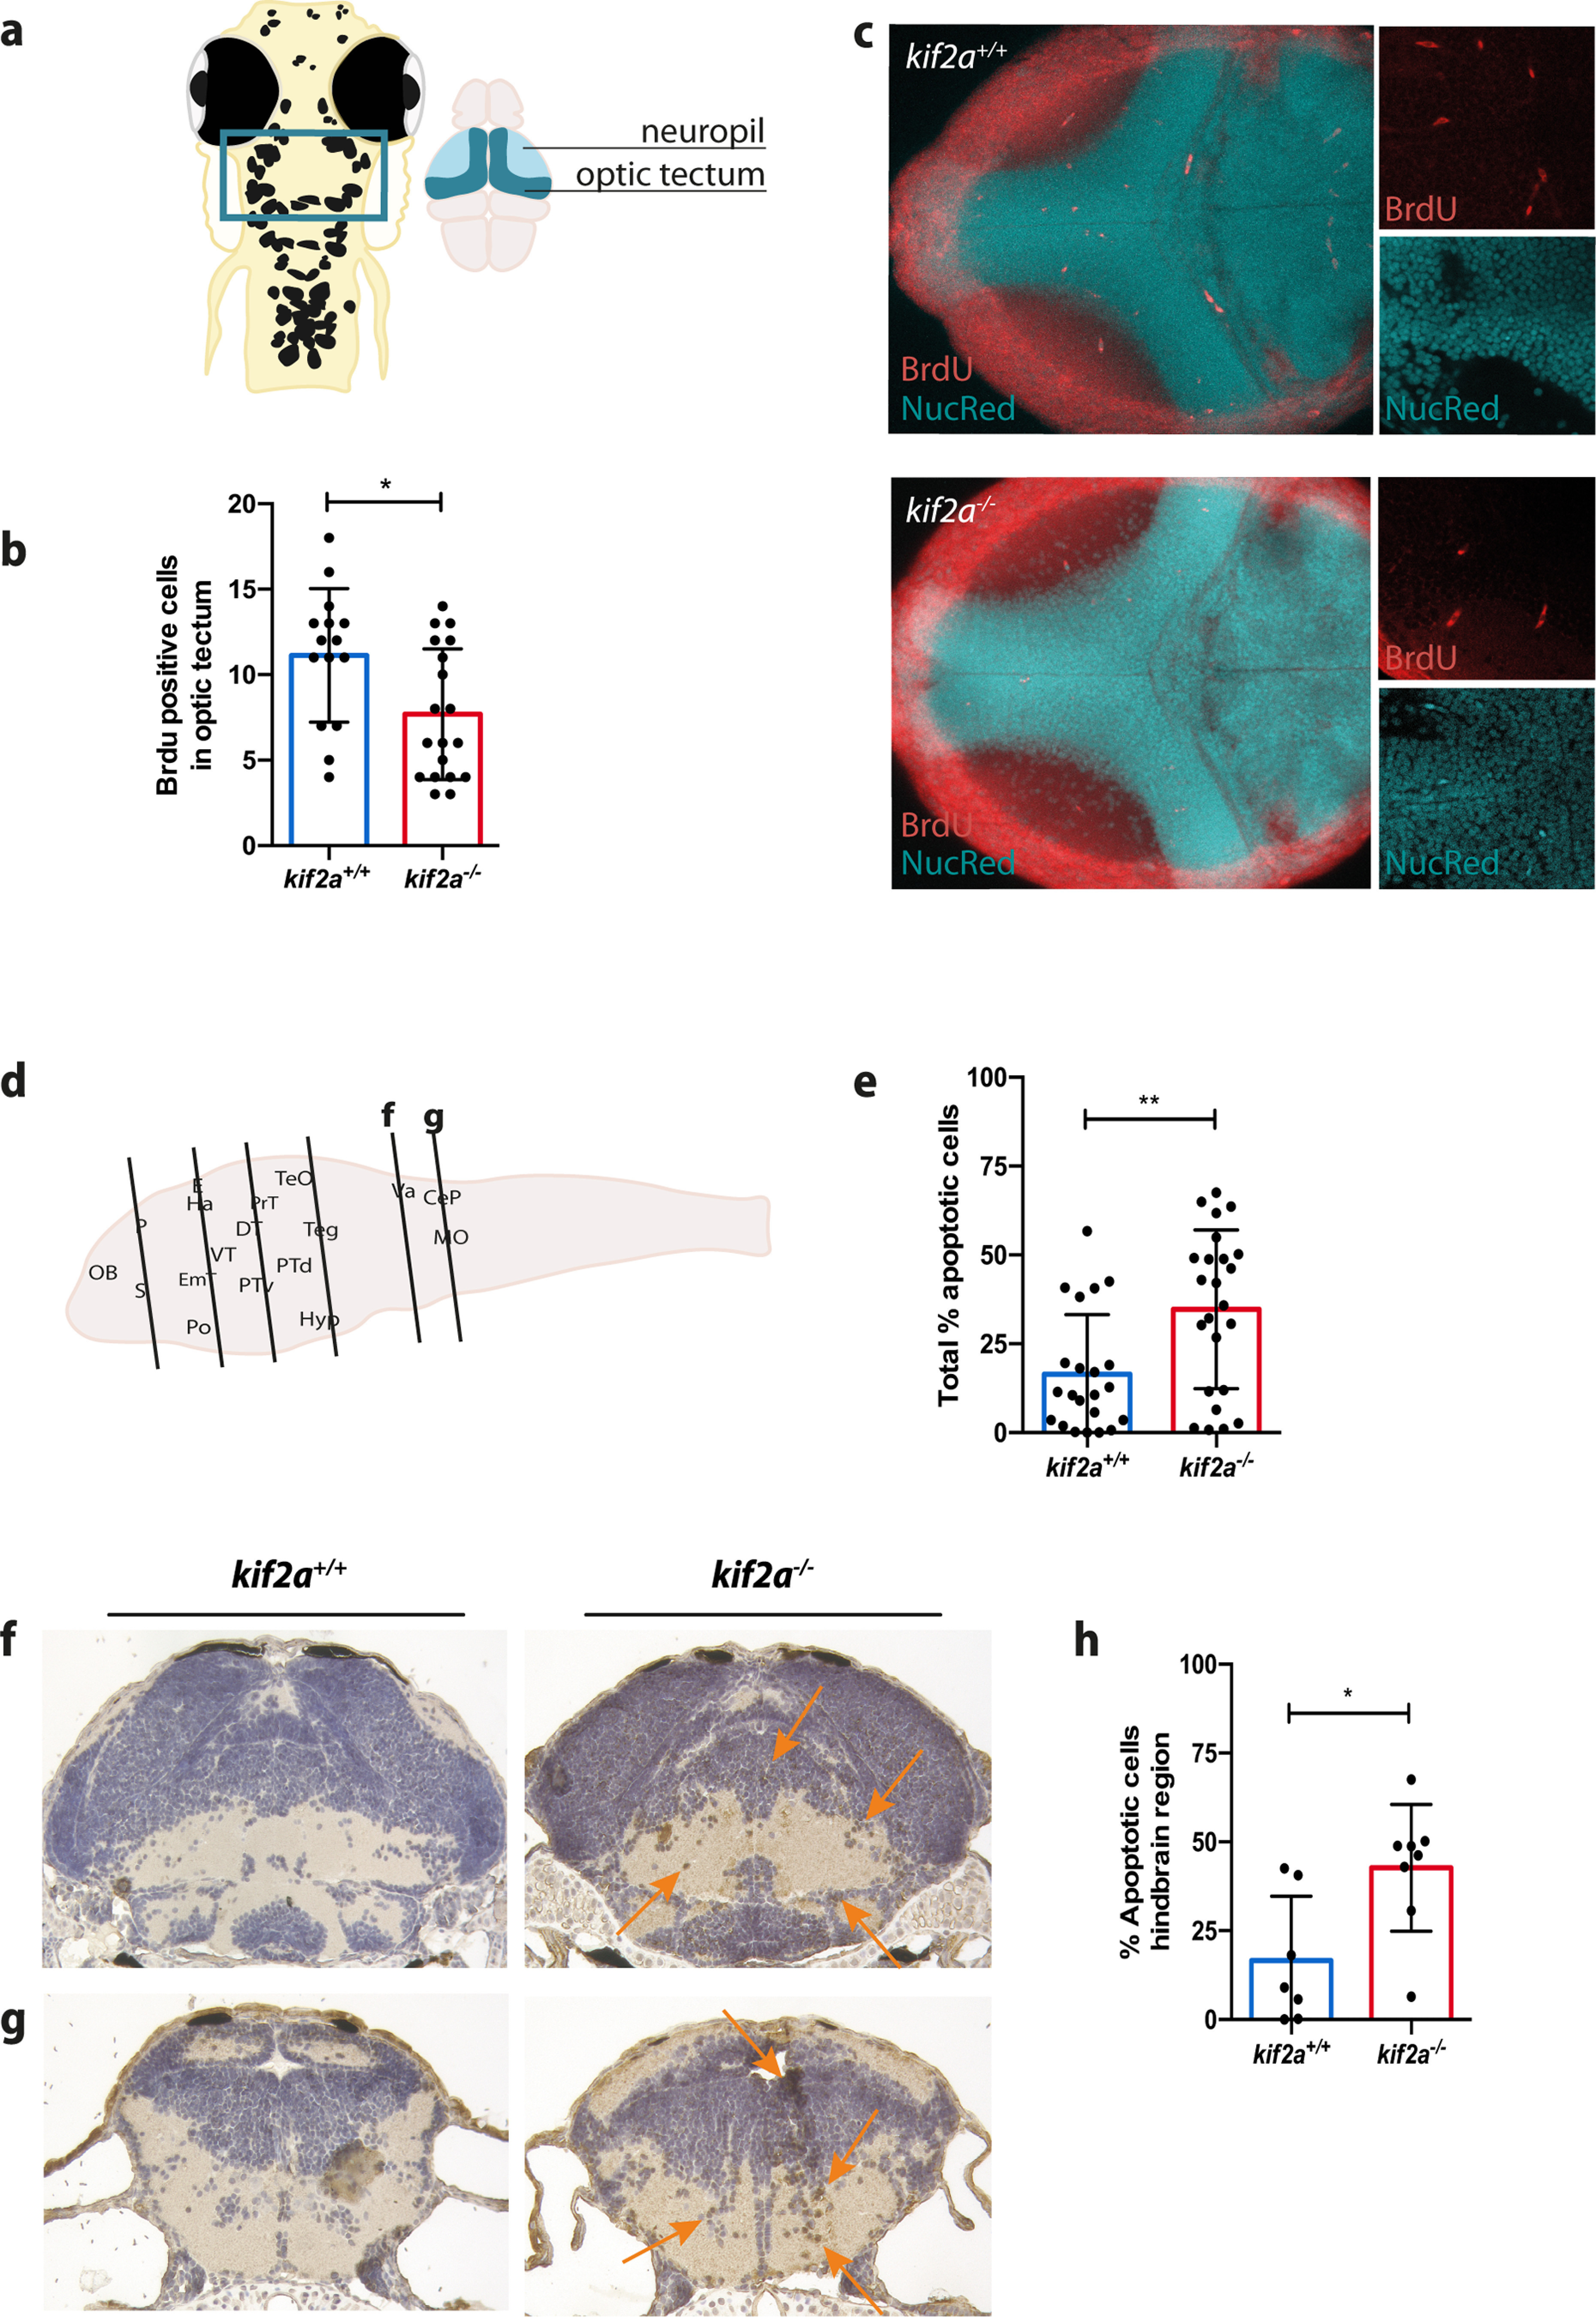
- Partoens et al., 2021 - Modelling neurodevelopmental disorders and epilepsy caused by loss of function of kif2a in zebrafish
- All Figures
- Figures for Partoens et al., 2021
|
Figure 6.
Neuronal cell proliferation defects and increased apoptosis in