
|
Figure 3
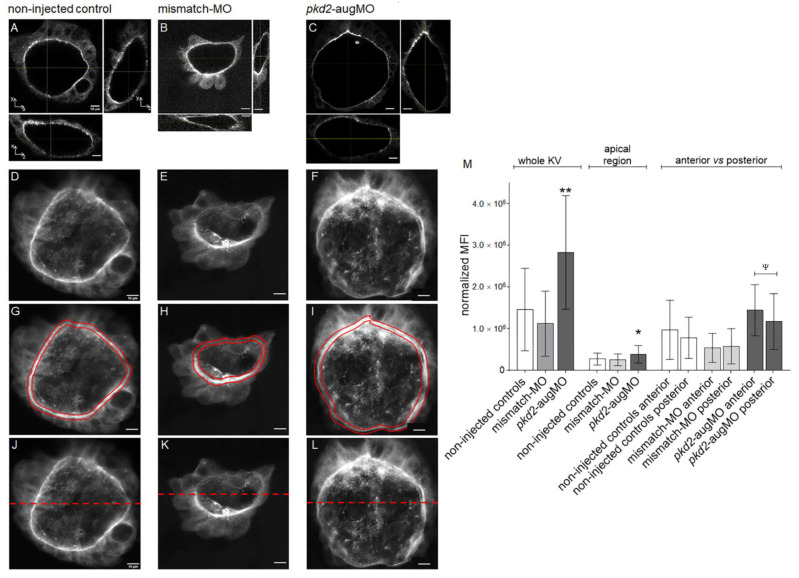
Estimated CFTR-GFP protein level in KVs of TgBAC(cftr-GFP)pd1041 embryos. (A–L) Confocal live-scan analysis. The middle plan along the xy axis and its respective orthogonal views (along xz and yz axes) and the image resulting from the sum of all slices of the confocal live-microscopy scan of the whole KV are, respectively, shown for the most representative non-injected control (A,D), mismatch-MO (B,E), and pkd2-knockdown (C,F) embryos. (G–I) The apical region of the KV cells of (D,E,F) is highlighted in red. (J–L) anterior (upper) versus posterior (lower) parts of the KV are highlighted. (M) MFI determined for the whole KV, KV cells’ apical region and KV’s anterior versus posterior regions of non-injected control (n = 15), mismatch-MO (n = 6), and pkd2-knockdown (n = 20) embryos. Median averages ± SD are indicated. t-test was used to compare whole KV MFIs of pkd2-augMO versus non-injected embryos (samples with normal distribution and equal variances), ** p < 0.01. Mann–Whitney test was used to compare the MFIs of KV cells’ apical region of pkd2-augMO versus non-injected embryos (samples that did not passed normality tests), * p < 0.05. Paired t-test was used to compare the anterior versus posterior MFIs for each situation (all samples having normal distribution), ψ p < 0.05. Scale bars: 10 μm.