
Image
|
Figure Caption
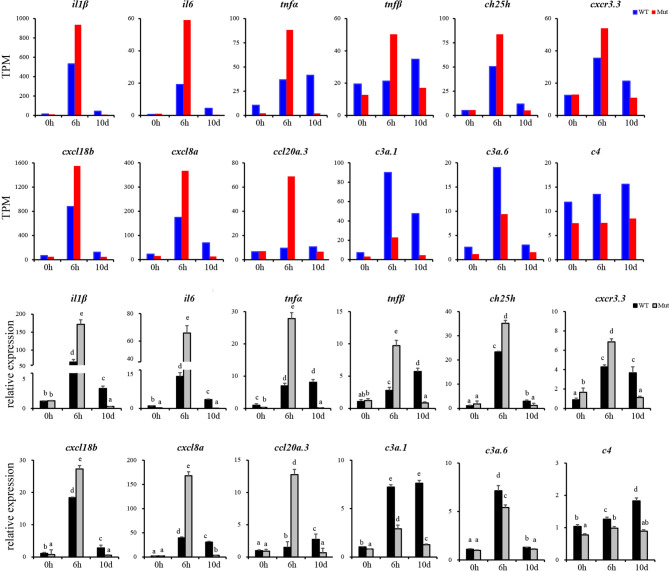
Figure 8
Validation of the 12 DEGs by qRT-PCR. WT animals and congenitally asplenic zebrafish sampled at 0 h were used as controls. The data were normalized to the expression level of WT-0h. The data are reported as the mean ± SEM. Different letters (a, b , c etc.) indicate significant differences (
Acknowledgments
This image is the copyrighted work of the attributed author or publisher, and
ZFIN has permission only to display this image to its users.
Additional permissions should be obtained from the applicable author or publisher of the image.
Full text @ Front Cell Infect Microbiol