IMAGE

Fig. 7.

ID
ZDB-IMAGE-210708-49
Source
Figures for Sidik et al., 2021
Image
Figure Caption

Fig. 7.

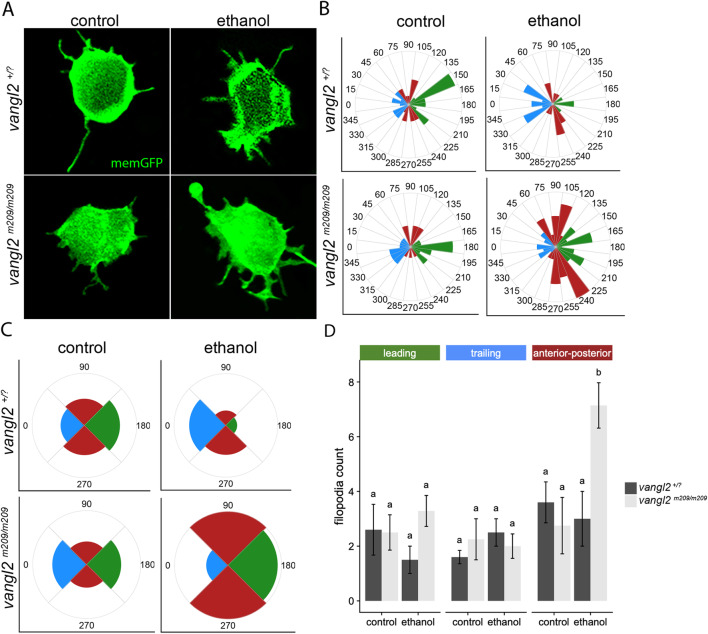
Ethanol disrupts the polarity of membrane protrusions in vangl2 mutants. a Confocal images of mesodermal cells expressing memGFP at 10 hpf. Ethanol treatment from 6–10 hpf. b–c Rose diagram of filopodial projections representing length and distribution around the cells, using b 24 bins, divided into 15° angles or c 4 bins, divided into 90° angles. Horizontal plane (0°) represents the mediolateral axis; vertical plane (90°) represents the anterior-posterior axis. d Quantification of the number of filopodia. n=6, for each group (p < 0.05; Tukey’s honest test). P values provided in Additional file 9: Table S2

Figure Data
Acknowledgments
This image is the copyrighted work of the attributed author or publisher, and ZFIN has permission only to display this image to its users. Additional permissions should be obtained from the applicable author or publisher of the image. Full text @ BMC Biol.