
Image
|
Figure Caption
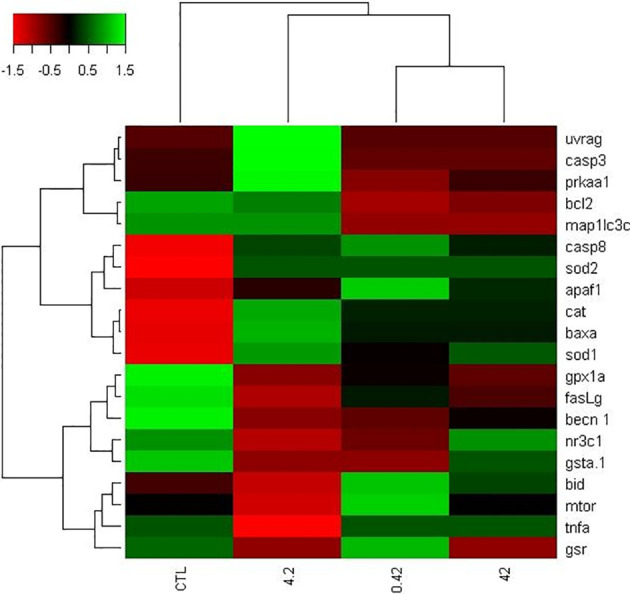
Figure 1
Gene expression heatmap (autophagy, apoptosis and oxidative stress) from zebrafish ovaries exposed to DINP. Color code to represented upregulated genes (green) and downregulated genes (red). Both rows (genes) and columns (treatments) were grouped by hierarchical clustering.
Acknowledgments
This image is the copyrighted work of the attributed author or publisher, and
ZFIN has permission only to display this image to its users.
Additional permissions should be obtained from the applicable author or publisher of the image.
Full text @ Front Endocrinol (Lausanne)