
|
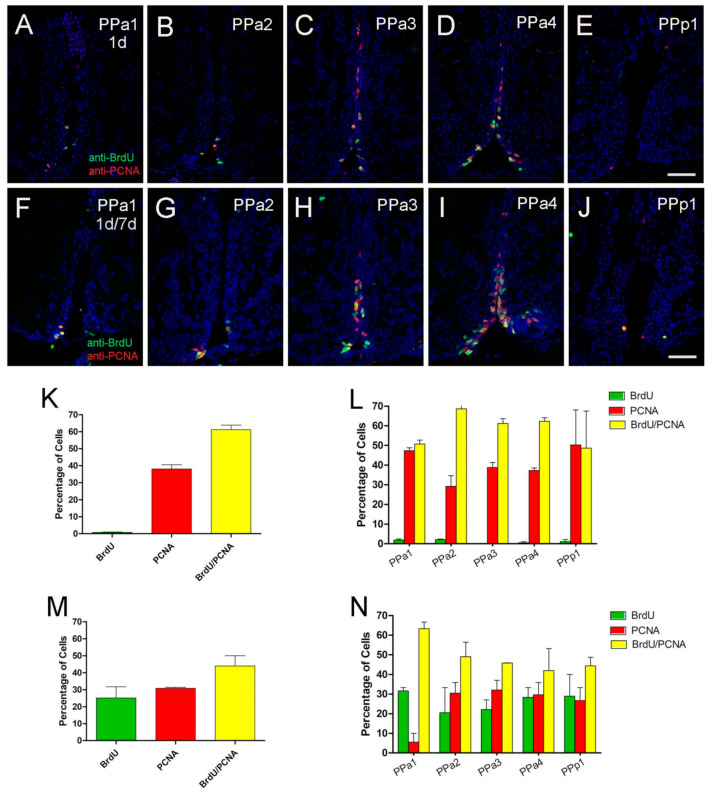
Figure 5 POA generates new cells with 8-day pulse-chase labeling. (A–J) BrdU/PCNA double immunofluorescence in transverse paraffin sections of 5 µm. (A–E) Treatment with one pulse of BrdU on day 1 and brains fixed on the second day. (F–J). Treatment with two pulses of BrdU at 1 and 7 days, and brains were fixed at day 8. All sections were labeled with DAPI (blue). Scale bar: 30 μm. (K,M) Percentage of cells double or single labeled for BrdU or PCNA located in the POA, with single-BrdU pulse on day 1 (K) and two BrdU pulses at 1 and 7 days (M). (L,N) Percentage of cells double or single labeled for BrdU or PCNA in representative sections of the POA with single-BrdU pulse on day 1 (L) and two BrdU pulses at 1 and 7 days (N). For each representative region of the POA, the number of sections (L) (PPa1 = 5, PPa2 = 10, PPa3 = 13, PPa4 = 12, and PPp1 = 4) and (N) (PPa1 = 5, PPa2 = 10, PPa3 = 13, PPa4 = 12, and PPp1 = 4) labeled, BrdU+, PCNA+ and BrdU+/PCNA+ cells were counted. Graphs plotted with SEM.