
|
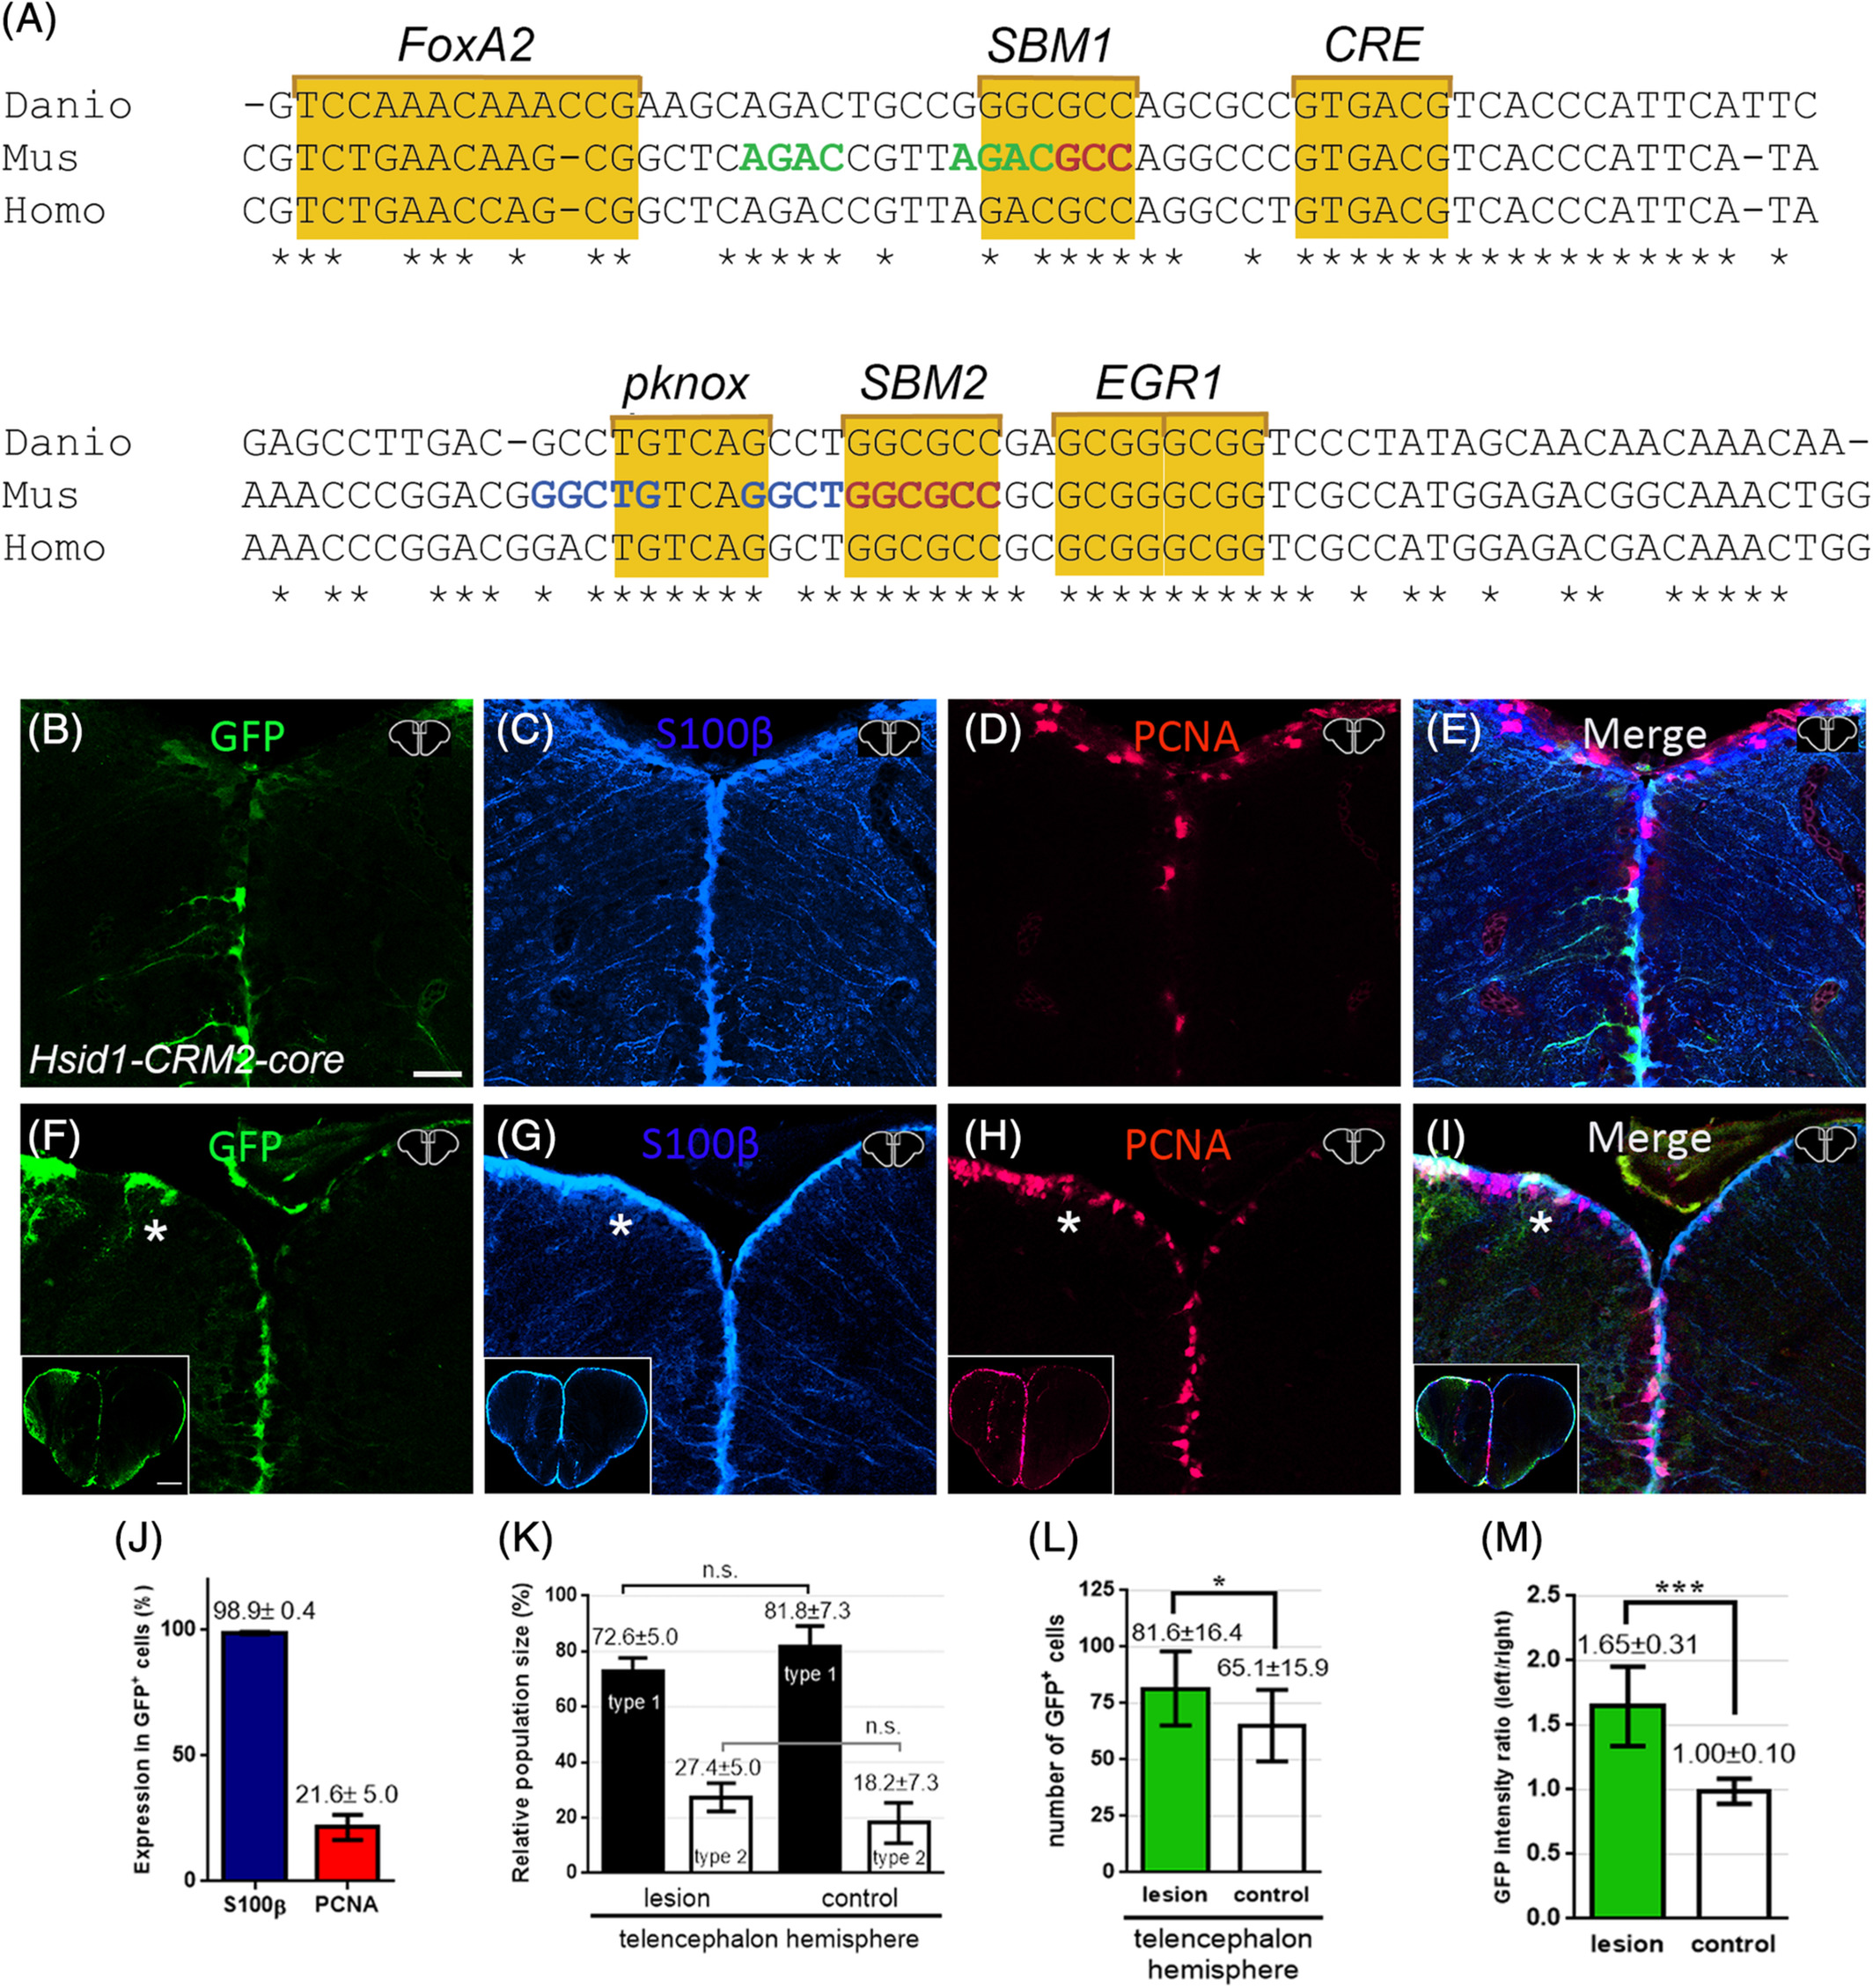
Fig. 3 Conservation of the zebrafish id1‐CRM2 core sequences and its function across evolution. A, Sequence comparison of zebrafish id1‐CRM2‐core (Danio) with human (Homo) and mouse (Mus) orthologous sequences. Conserved nucleotides are indicated with an asterisk. Conserved motifs are outlined by yellow boxes comprising putative DNA recognition sequences for the transcription factors FoxA2, Smad (SBM1 and 2), CRE binding protein (CREB), Pknox, and EGR1. Nucleotide sequences in green, red, or blue correspond to previously identified sequences in the mouse id1 orthologue: Smad binding element (SBE), a Smad 1/5 binding site and a binding site for an unknown binding protein, respectively. B‐I, Immunohistochemistry of telencephalic transverse sections with antibodies against GFP (B, F), S100ß (C, G), and PCNA (D, H) (merged panels: E, I). B, Expression of GFP in RGCs at the telencephalic ventricular zone driven by the human id1 regulatory sequences in the zebrafish adult telencephalon. F, Expression of the human Tg(Hsid1‐CRM2) driven reporter construct is upregulated upon stab wound injury. The injured telencephalic hemisphere is labeled with a white asterisk. J, Quantification of PCNA and S100ß expression in GFP+ cells in the Tg(Hsid1‐CRM2) line. K, Relative population size of type 1 and type 2 RGCs in the control and lesioned hemispheres. The proportion of GFP+/S100β+/PCNA− type 1 and GFP+/S100+/PCNA+ type 2 stem cells is not altered in the injured hemisphere relative to the control hemisphere of the telencephalon. L, M, Quantification of GFP+ cells upon injury. The number of GFP‐expressing cells (L) and the intensity ratio between left and right hemispheres comparing undamaged hemisphere (control) and damaged telencephalic hemisphere (M) are both increased following injury. Bars: mean ± SD. Significance is indicated by asterisks: *.01 ≤ P < .05; ***P < .001. n.s. = not significant. Boxed in image in lower left‐hand corner of (F‐I) represents entire brain sections. n = 3 animals (B‐L), n = 15 sections (M). Scale bar = 20 μm (B‐I); 200 μm for boxed image in lower left‐hand corner of F‐I