
|
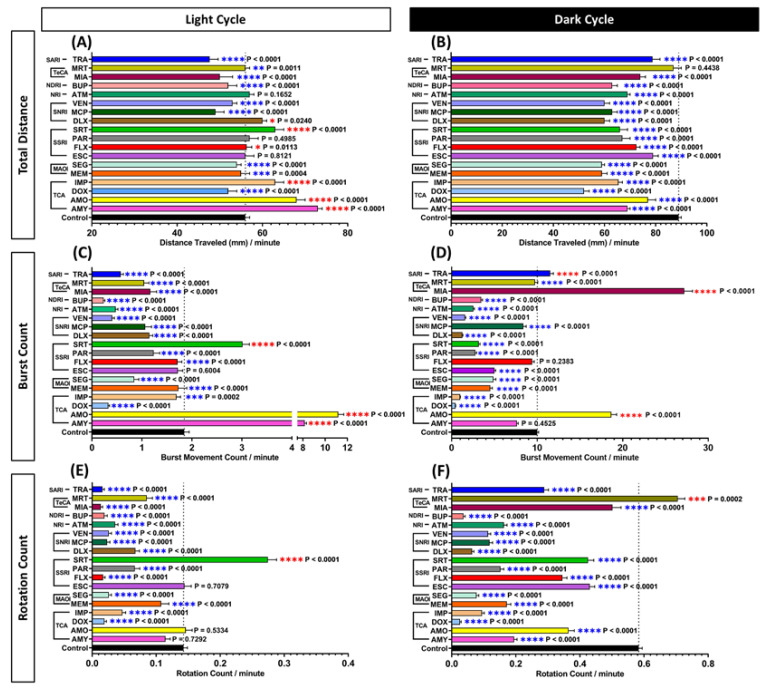
Figure 2 Comparison of (A,B) total distance traveled, (C,D) average burst movement, and (E,F) rotation count of zebrafish larvae in light and dark cycles, respectively. The statistical significance was tested by Mann–Whitney test. Every treated group was statistically compared to the control group individually. Data are presented as median with 95% CI for (A,B), and as mean with SEM for (C–F). Blue asterisk indicates a significant decrease in the value and red asterisk indicates a significant increase in the value in comparison to the control group (n = 144 for control, n = 48 for each tested antidepressant; * p < 0.05, ** p < 0.01, *** p < 0.001, **** p < 0.0001). The details of these two-way ANOVA test results can be found in Table S1.