
|
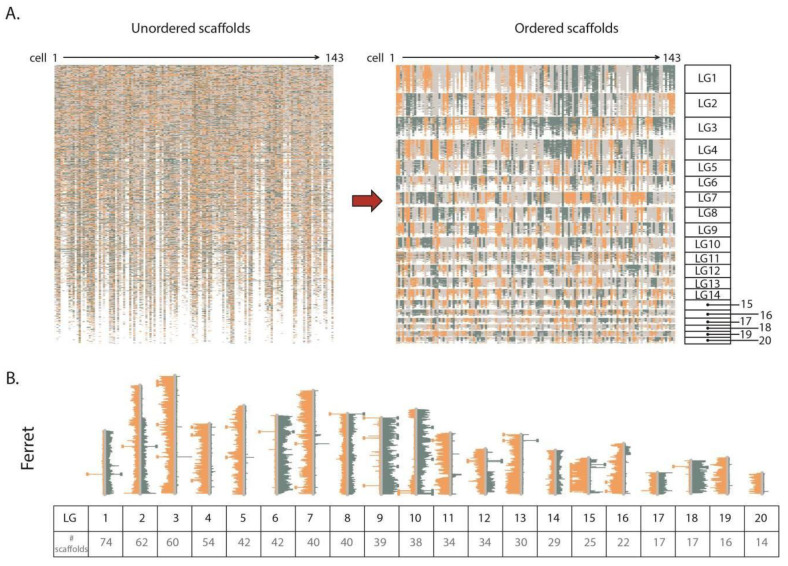
Figure 4 Assemblies made from non-contiguous scaffolds based on Strand-seq data. (A) Left panel shows ferret scaffolds presented in the current assembly order. Orange, blue, and grey represent scaffolds with WW, CC, and WC reads respectively. Right panel shows scaffolds after contiBAIT reordering. (B) Representative ideogram plot of a ferret library after clustering and ordering scaffolds. Each linkage group is represented by a certain number of scaffolds. Chromosomes with WW, WC, and CC inheritance patterns are observed in this library. Changes in strand state represent sister chromatid exchange (SCE) events and are used to map the relative locations of scaffolds.