
|
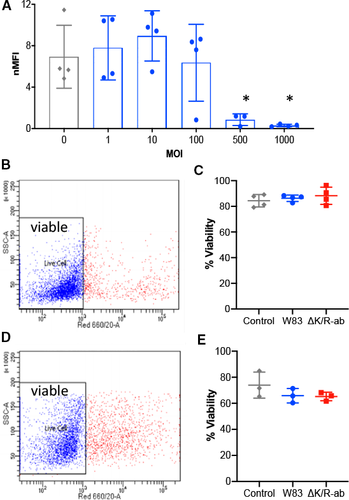
Fig. 4 Pg‐mediated decrease in PECAM‐1 cell surface abundance is MOI‐dependent on viable endothelial cells. (A) PECAM‐1 cell surface abundance on HMEC‐1 cells as determined by flow cytometric analysis following infection with increasing MOI of Pg; uninfected cells were used as controls (enclosed circles represent data from each individual experiment). Data are displayed as normalised median fluorescence intensity (nMFI), and statistical differences were analysed by one‐way ANOVA with Tukey’s multiple comparison test; *P < 0.05, **P < 0.01 compared with MOI 0, 1, 10. HMEC‐1 (B&C) and HDMEC (C&D) viability postinfection as assessed by a live/dead TO‐PRO‐3 exclusion flow cytometric assay. The level of per cent viable cells (TO‐PRO‐3‐negative, blue dots) in the cell population was measured for W83 and ΔK/R‐ab‐treated cells. One‐way ANOVA with Tukey’s multiple comparison test showed no statistically significant differences in cell survival between groups following infection.