
|
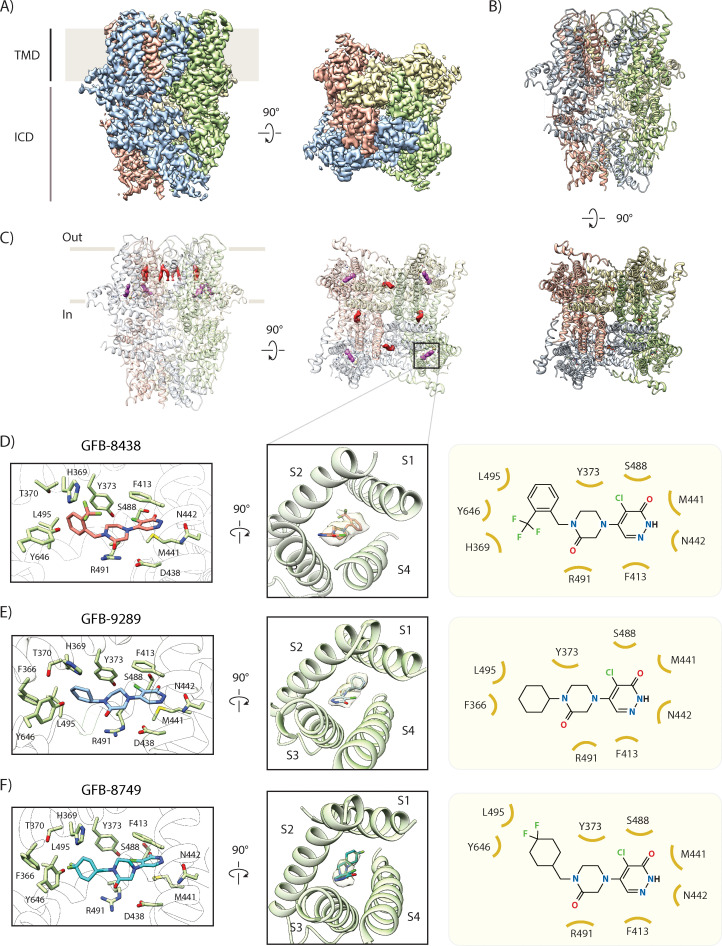
Figure 2 (A) Side and top view of the cryo-EM map of GFB-8438 inhibitor-bound TRPC4, with each subunit colored differently. Positions of the transmembrane domain (TMD) and intracellular cytosolic domain (ICD) are indicated. (B) Side and top view of the structure of GFB-8438 inhibitor-bound TRPC4, with each subunit colored differently. (C) Location of non-protein densities relative to the atomic model of TRPC4, which is shown in transparent ribbon representation in the side- and top view. Densities corresponding to lipids are depicted in red, GFB-8438 density is shown in purple. (D) Close-up of the ligand-binding pocket, showing the density corresponding to the inhibitor GFB-8438(transparent) with the ligand structure modelled inside. GFB-8438 is enclosed by the four helices S1 to S4, constituting the VSL domain. A rotated view of the ligand-binding pocket is shown in the left panel with important and interacting residues highlighted. GFB-8438 is shown in purple. In the right panel the chemical structure of the TRPC4 inhibitor GFB-8438 is shown, with important and interacting residues of TRPC4 highlighted. Non-carbon atoms are colored according to element, with halogens in green, nitrogen in blue and oxygen in red. (E) and (F) Same in (D) but for inhibitor GFB-9289 and GFB-8749 bound structures of TRPC4 respectively.