
IMAGE
Fig 6
- ID
- ZDB-IMAGE-210319-45
- Publication
- Owen et al., 2021 - A suitable anaesthetic protocol for metamorphic zebrafish
- All Figures
- Figures for Owen et al., 2021
Image
|
Figure Caption
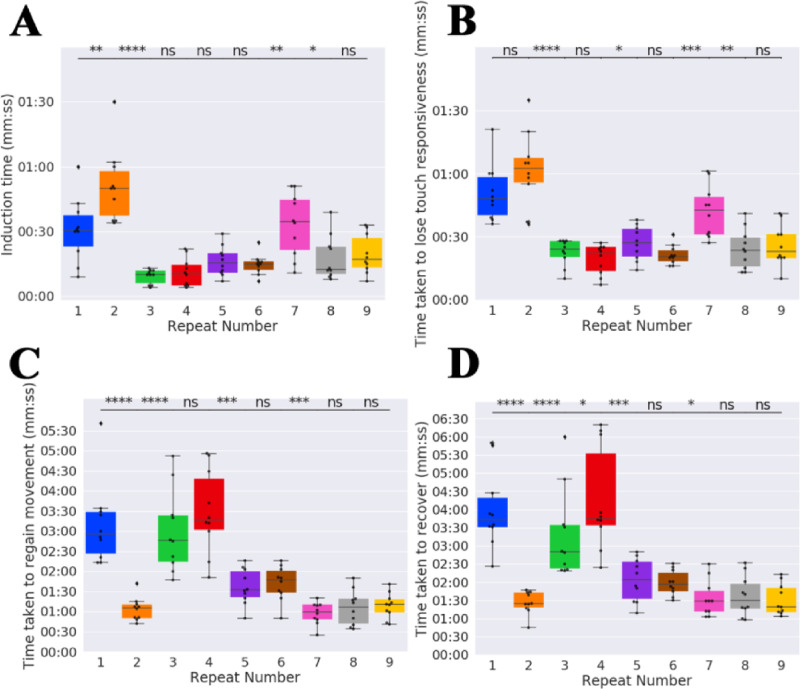
Fig 6
Boxplot of (A) induction time, (B) time taken to lose touch responsiveness, (C) time taken to regain movement and (D) time taken to recover. Stars indicate significant difference of subsequent repeats as determined using the Mann-Whitney U test. ns = not significant, ‘*’ indicates p<0.05, ‘**’ indicates p<0.01, ‘***’ indicates p < 0.001 and ‘****’ indicates p<0.0001.
Acknowledgments
This image is the copyrighted work of the attributed author or publisher, and
ZFIN has permission only to display this image to its users.
Additional permissions should be obtained from the applicable author or publisher of the image.
Full text @ PLoS One