
|
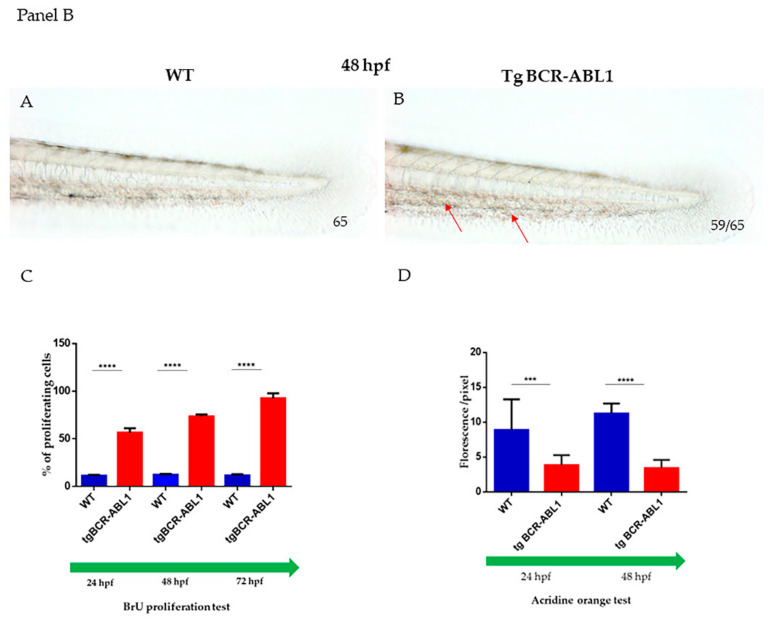
Figure 2 Panel (A). (A,C) Bright-light images of live wild type (WT) and Tg BCR-ABL1 at 24 hpf; the accumulated hematopoietic cells are indicated in the red box. (B,D) The areas in the red boxes are shown at higher magnification (12.5 X). The region (boxed) of posterior blood islands is enlarged and show the immunofluorescence staining of phospohistone3. All the experiments were performed at least in triplicate; images show one representative experiment. Numbers in each panel represent total embryos used for the experiment and embryos with the phenotype shown in the image. (E) Immunostaining with phospohistone 3 (PH3) to label cells in M-phase: percentage of PH3 positive cells over the total number cells present in posterior blood islands. (Magnification 7X A, C; 12.5 X B, D) Blue bar represents wild type; red bar represents Tg BCR-ABL1. Statistical analysis was performed by unpaired, two-tailed T Test **** p < 0.0001. Panel (B) (A,B) Bright light images of wild type (WT) and Tg BCR-ABL1 at 48 hpf. The images show a particular of the caudal hematopoietic tissue (CHT). Red arrows indicate cells accumulated in CHT. (C) The graph of BrdU staining show the percentage of proliferating cells in WT and Tg BCR-ABL1 at 24, 48 and 72 hpf; (D) Quantification of the fluorescence of embryos at 24 and 48 hpf shown in Figure S3 acquired by ZF-Mapper software. Blue bar represents wild type; red bar represents Tg BCR-ABL1. All the experiments were done at least three times. Unpaired, two-tailed t-test *** p < 0.001, **** p < 0.0001.