
Image
|
Figure Caption
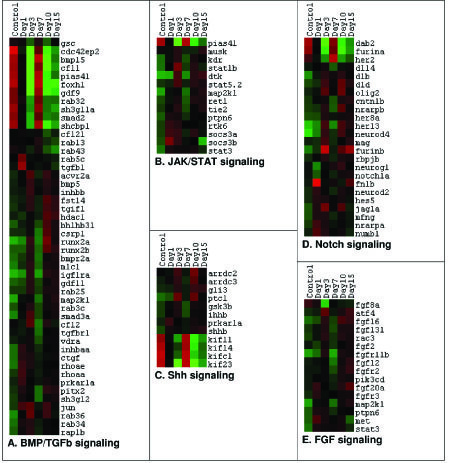
Fig. S8 Differentially expressed genes involved in different signaling pathways in zebrafish spinal cord after injury. A–E) Dendrograms representing genes related to BMP/TGFβ signaling, JAK/STAT signaling, Shh signaling, Notch signaling and FGF signaling respectively. Each horizontal line indicates the expression pattern of each gene and the vertical columns indicate the uninjured control and time points after SCI. The color chart indicates mean fold change of gene expression in each time points. Red and green colors represent increased and decreased expression respectively.
Acknowledgments
This image is the copyrighted work of the attributed author or publisher, and
ZFIN has permission only to display this image to its users.
Additional permissions should be obtained from the applicable author or publisher of the image.
Full text @ PLoS One