IMAGE

FIGURE 2

ID
ZDB-IMAGE-201229-9
Source
Figures for Andrés-Delgado et al., 2020
Image
Figure Caption

FIGURE 2

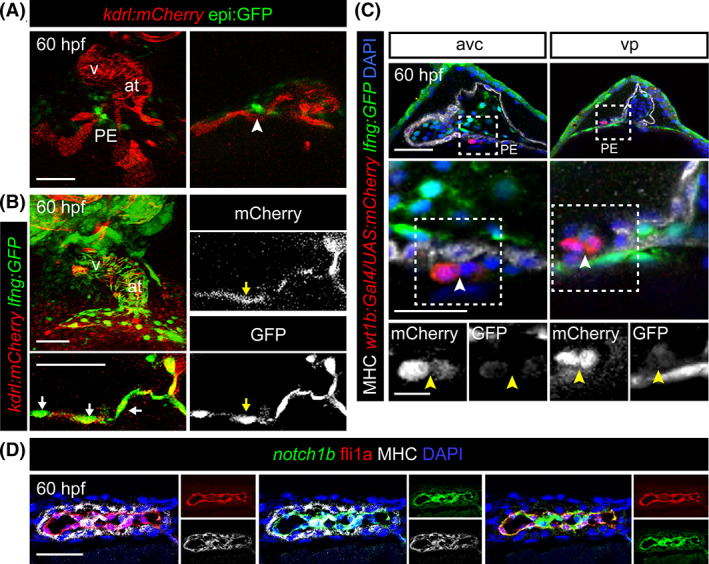
Notch signaling is active in endothelial cells. A, 3D projection and optical section of a 60 hpf epi:GFP; kdrl:mCherry double transgenic embryos. GFP+ pericardium and PE are shown in green, the mCherry+ endothelium is in red. Arrowhead, PE cluster. B, Maximum projection and optical sections of a 60 hpf zebrafish heart. lnfg:GFP+ cells (green) colocalize with the endogenous mCherry+ endothelium (red) of kdrl:mCherry. Arrows, lnfg:GFP+/kdrl:mCherry+ cells. C, Optical sections through the avc and vp heart regions of 60 hpf wt1b:Gal4;UAS:mCherry; lnfg:GFP embryos immunostained for mCherry (red), GFP (green), myosin heavy chain (MHC, white) and nuclei counterstained with DAPI (blue). Zoomed views including single channels are shown below. Arrowheads, PE cluster. D, Fluorescent in situ mRNA hybridization on a 60 hpf fli1a:GFP ventricular heart section with notch1b riboprobe (green) followed by immunofluorescence for GFP (red) and myosin heavy chain (MHC, gray). Nuclei are counterstained with DAPI (blue). at, atrium; avc, atrioventricular canal; DP, dorsal pericardium; hpf; hours post fertilization; PE, proepicardium; v, ventricle; vp, venous pole. Scale bar: 50 μm (25 μm in C middle images and in D; 10 μm in C zoomed images)

Acknowledgments
This image is the copyrighted work of the attributed author or publisher, and ZFIN has permission only to display this image to its users. Additional permissions should be obtained from the applicable author or publisher of the image. Full text @ Dev. Dyn.