IMAGE

FIGURE 1

ID
ZDB-IMAGE-201229-8
Source
Figures for Andrés-Delgado et al., 2020
Image
Figure Caption

FIGURE 1

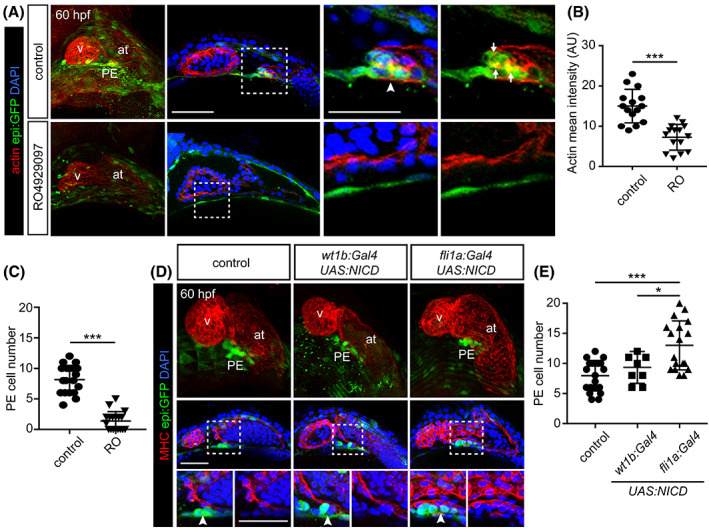
Notch signaling in the endothelium is necessary for proepicardium formation. A, 3D projections, optical sections and zoomed images of a 60 hpf control zebrafish heart compared with a RO‐treated animal. epi:GFP animals immunostained for GFP (green), F‐actin is detected with fluorescently‐labeled phalloidin (red) and nuclei counterstained with DAPI (blue). Arrowhead, PE cluster. Arrows, accumulation of F‐actin in the PE. B, Quantification of actin intensity (arbitrary units) in PE cells from conditions shown in A. C, Quantification of PE cell number in A. D, Top panels, 3D projection of a 60 hpf zebrafish heart, middle panels optical section and zoomed images below. The DP was digitally isolated in 3D projections. Control compared to those overexpressing NICD in pericardial and proepicardial cells (wt1b:Gal4) or in endothelial cells (fli1a:Gal4). epi:GFP embryos immunostained for GFP (green), myosin heavy chain (MHC, red) and nuclei counterstained with DAPI (blue). Arrowheads, PE cluster. E, Quantification of PE cell number in D. at, atrium; DP, dorsal pericardium; hpf; hours post fertilization; PE, proepicardium; v, ventricle. Scale bar: 50 μm. Data are means ± SD. Unpaired two‐tailed Student's t‐test in B and C. One‐way ANOVA followed by Kruskal‐Wallis significant difference test in E. *P < .05, ***P < .001

Acknowledgments
This image is the copyrighted work of the attributed author or publisher, and ZFIN has permission only to display this image to its users. Additional permissions should be obtained from the applicable author or publisher of the image. Full text @ Dev. Dyn.