
Image
|
Figure Caption
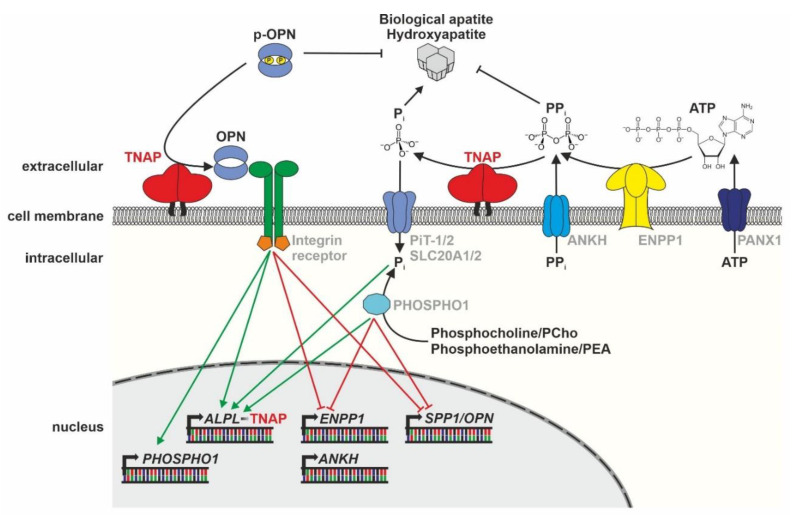
Figure 2
Schematic model of TNAP function within mineralizing cells (Modified according to Yadav et al. 2014 [
Acknowledgments
This image is the copyrighted work of the attributed author or publisher, and
ZFIN has permission only to display this image to its users.
Additional permissions should be obtained from the applicable author or publisher of the image.
Full text @ Biomolecules