IMAGE

Fig. 3.

ID
ZDB-IMAGE-201202-16
Source
Figures for Fornetto et al., 2020
Image
Figure Caption

Fig. 3.

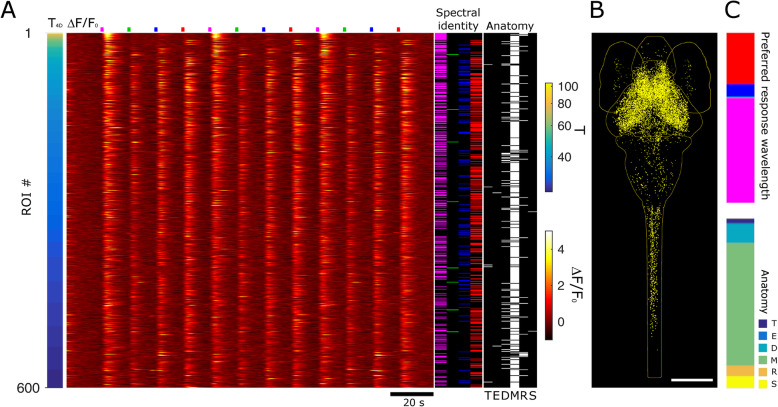
Stimulus-induced neuronal activity: spectral and anatomical mapping. a Heatmap of 600 ROIs ranked by T4D values in a 5-dpf larva. The bar on the left shows T4D values (mapped with the T color scale shown on the right of the panel). The main panel shows ΔF/F0 calcium responses of the 600 neurons (mapped with the ΔF/F0 color scale shown on the right of the panel). Stimulus time points are indicated in their respective colors above the panel. The spectral identity column (next to the heatmap) indicates the spectral identity of each neuron as determined by the threshold analysis: magenta, green, blue, and red lines indicate neurons responsive to L1, L2, L3, and L4 stimuli, respectively; black indicates no response to the visual stimulus. The anatomy column shows the localization of each of the 600 neurons (T, telencephalon; E, eyes; D, diencephalon; M, mesencephalon; R, rhombencephalon; S, spinal cord). Scale bar, 190 μm. b Anatomical map of neurons selected above the T4D threshold (yellow dots) for 7 larvae at 5 dpf registered onto a reference brain (outlines of the anatomical regions mentioned above are displayed in light yellow). c Quantification of spectral and anatomical identities (N = 7 larvae). The top bar graph shows the normalized distribution of all responsive neurons above the T4D threshold across the four spectral stimuli (with their respective color code). The bottom bar graph quantifies the anatomical distribution of the neurons across the CNS areas with the following color coding from top to bottom: dark blue, telencephalon; light blue, eye; turquoise, diencephalon; green, mesencephalon; orange, rhombencephalon; and yellow, spinal cord. The same data with standard errors are shown in Additional file 3:Fig. S3

Acknowledgments
This image is the copyrighted work of the attributed author or publisher, and ZFIN has permission only to display this image to its users. Additional permissions should be obtained from the applicable author or publisher of the image. Full text @ BMC Biol.