IMAGE

Figure 3

ID
ZDB-IMAGE-201130-37
Source
Figures for Lai et al., 2020
Image
Figure Caption

Figure 3

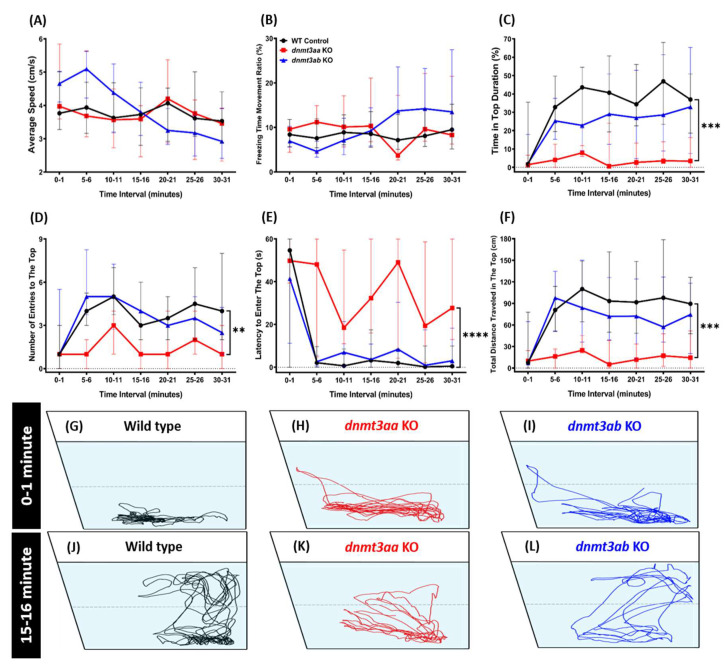
Comparison of behavior endpoints among the wild-type, dnmt3aa, and dnmt3ab mutant fish during a 30-min novel tank exploration test. (A) Average speed, (B) freezing time movement ratio, (C) time in bottom duration, (D) number of entries to the top, (E) latency to enter the top, and (F) total distance traveled in the top fish tank were analyzed. The data are expressed as the median with interquartile range and analyzed by two-way ANOVA (n = 30 for wild type; n = 7 for dnmt3aa KO fish; n = 30 for dnmt3ab KO fish; ** p < 0.01, *** p < 0.005, ****, p < 0.0001). (GI) The locomotion trajectories of a single fish of wild type, dnmt3aa KO, and dnmt3ab KO fish, right after introduced to a novel environment. (JL) The locomotion trajectories of a single fish of the wild type, dnmt3aa KO, and dnmt3ab KO fish after 15 min of novel tank exposure.

Figure Data
Acknowledgments
This image is the copyrighted work of the attributed author or publisher, and ZFIN has permission only to display this image to its users. Additional permissions should be obtained from the applicable author or publisher of the image. Full text @ Genes (Basel)