IMAGE

Fig. 3

ID
ZDB-IMAGE-201113-24
Source
Figures for Cook et al., 2020
Image
Figure Caption

Fig. 3

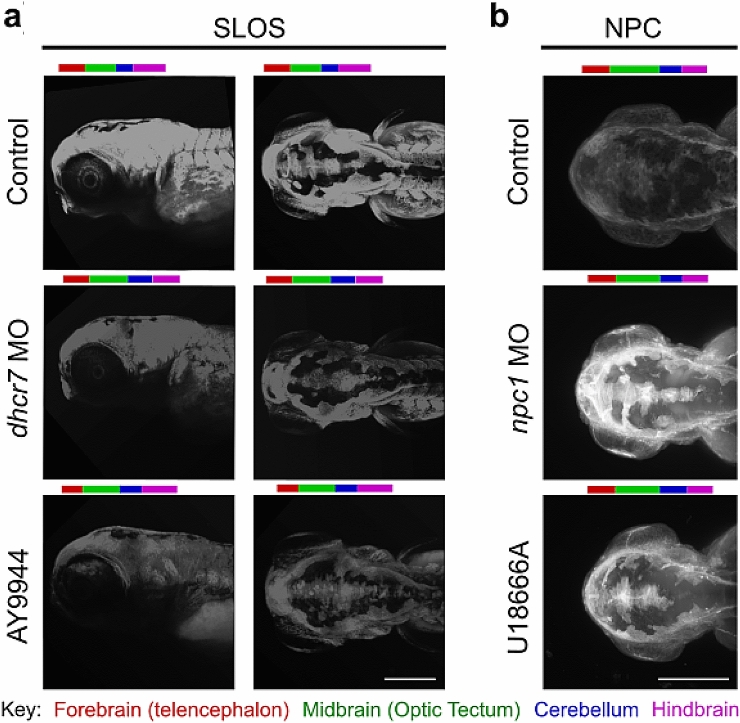
Cholesterol is reduced in SLOS model zebrafish and increased in NPC model zebrafish. Representative images of filipin staining of 96 hpf zebrafish to observe cholesterol distribution; a Filipin staining of SLOS zebrafish models induced using either the Dhcr7 inhibitor AY9944 (75 µM) or dhcr7 morpholino (dhcr7 MO) injected at the 1–2 cell stage. Images of the zebrafish head and upper body from a lateral view (left) or dorsal view (right); b Filipin staining of NPC zebrafish models induced using either npc1 morpholino (npc1 MO) injected at the 1–2 cell stage or the Npc1 inhibitor, U18666A (2 µg/ml). Images of the zebrafish head from a dorsal viewpoint. Brain areas are indicated by coloured bars above images. Scale bars = 280 µm. N = 3, with a minimum of ten fish per N

Figure Data
Acknowledgments
This image is the copyrighted work of the attributed author or publisher, and ZFIN has permission only to display this image to its users. Additional permissions should be obtained from the applicable author or publisher of the image. Full text @ Histochem. Cell Biol.