
|
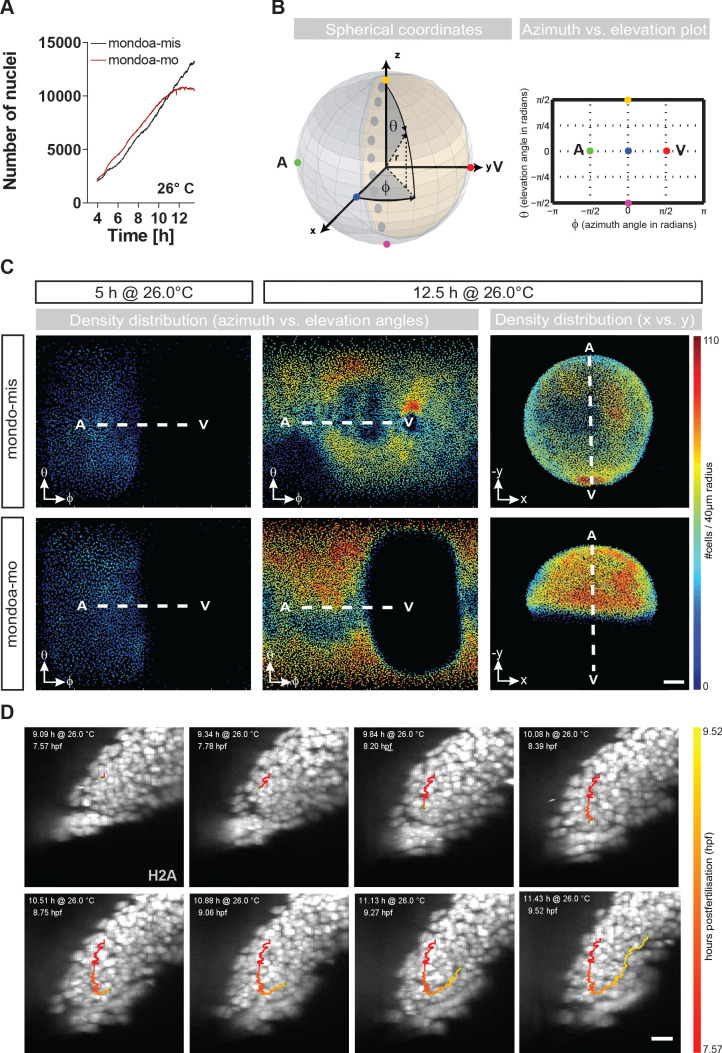
Figure 3 (A) Nuclei numbers over time in hours of mondoa-mis (black trace) and mondoa-mo (red trace) injected Tg(h2afva:h2afva-GFP) embryos. (B) Scheme illustrating the transformation of Cartesian coordinates of nuclei positions extracted from the DSLM image data into a two-dimensional plot of azimuth vs. elevation angles. For details, see Materials and methods section. (C) Cell density plots of mondoa-mis and mondoa-mo injected embryos after 5 and 12.5 hr of imaging using an azimuth vs. elevation angle plot to unwrap the embryos. For comparison, a projection of x and y Cartesian coordinates is also shown for the 12.5 hr data. Cell density is color-coded (number of cells/40 µm radius). (D) DSLM time lapse video stills from Video 5 of a morphant embryo. The trace of a single cell determined by automated cell nucleus tracking is highlighted (red to yellow). Scale bar, 20 µm.