IMAGE

Figure 2

ID
ZDB-IMAGE-200725-22
Source
Figures for Toms et al., 2020
Image
Figure Caption

Figure 2

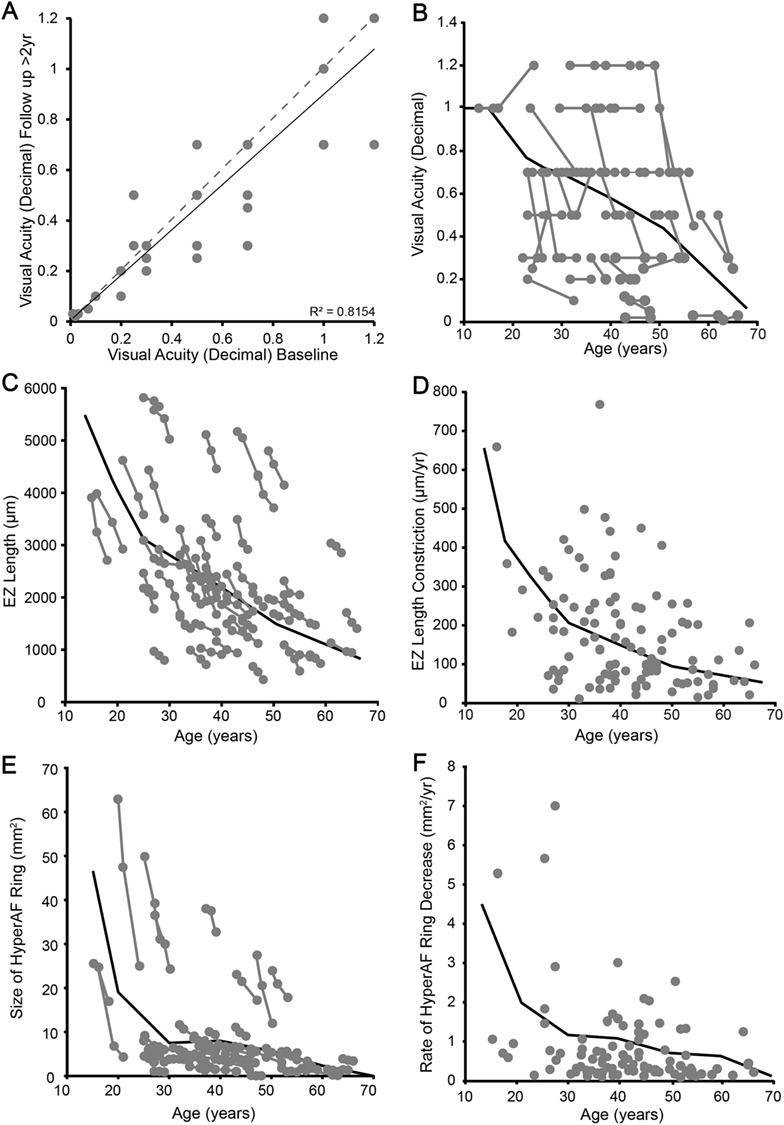
Visual acuity, EZ and hyperautofluorescent (hyperAF) ring measurements with age in USH2A patients. (A) and (B) Change in visual acuity over the observation period. (A) illustrates the change in BCVA between baseline and final follow up. The grey dashed line represents ‘no change’ while the black correlation line illustrates the subtle change. The measurement of each patient at each visit is depicted as a function of age in (B). (C) Correlation between EZ length and age. (D) EZ constriction rate (change in size divided by time between visits) as a function of age. Both (C) and (D) illustrate that the degeneration starts rapidly with later, slower decline. (E) and (F) illustrate the same changes in hyperAF ring area.

Acknowledgments
This image is the copyrighted work of the attributed author or publisher, and ZFIN has permission only to display this image to its users. Additional permissions should be obtained from the applicable author or publisher of the image. Full text @ Hum. Mol. Genet.