
Image
|
Figure Caption
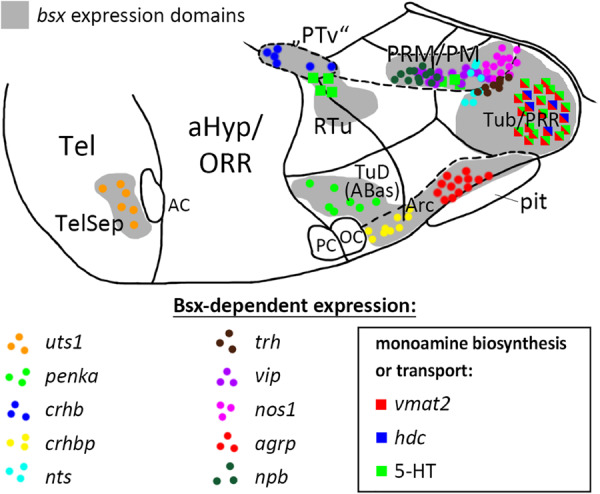
FIGURE 9
Distribution of Bsx-dependent neuronal cell types. Schematic representation of a sagittal view of the ventral forebrain in 3–4 dpf embryos showing
Acknowledgments
This image is the copyrighted work of the attributed author or publisher, and
ZFIN has permission only to display this image to its users.
Additional permissions should be obtained from the applicable author or publisher of the image.
Full text @ Front. Neurosci.