
Image
|
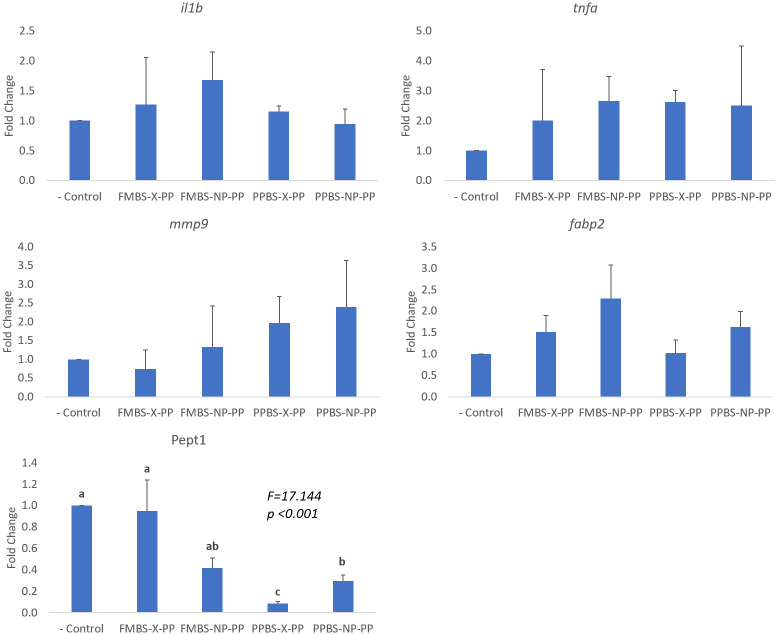
Figure Caption
Fig 2
Relative gene expression of the group is represented as a fold change relative to the negative control group (fold change = 1). Values provided are mean fold change + S.E.M (standard error of the mean). Results of One-way ANOVA and Tukey test are shown on graphs when significant. Significant differences (p<0.05) between groups are represented by different letters.
Acknowledgments
This image is the copyrighted work of the attributed author or publisher, and
ZFIN has permission only to display this image to its users.
Additional permissions should be obtained from the applicable author or publisher of the image.
Full text @ PLoS One