IMAGE

Figure 3

ID
ZDB-IMAGE-200413-15
Source
Figures for Pascoal et al., 2020
Image
Figure Caption

Figure 3

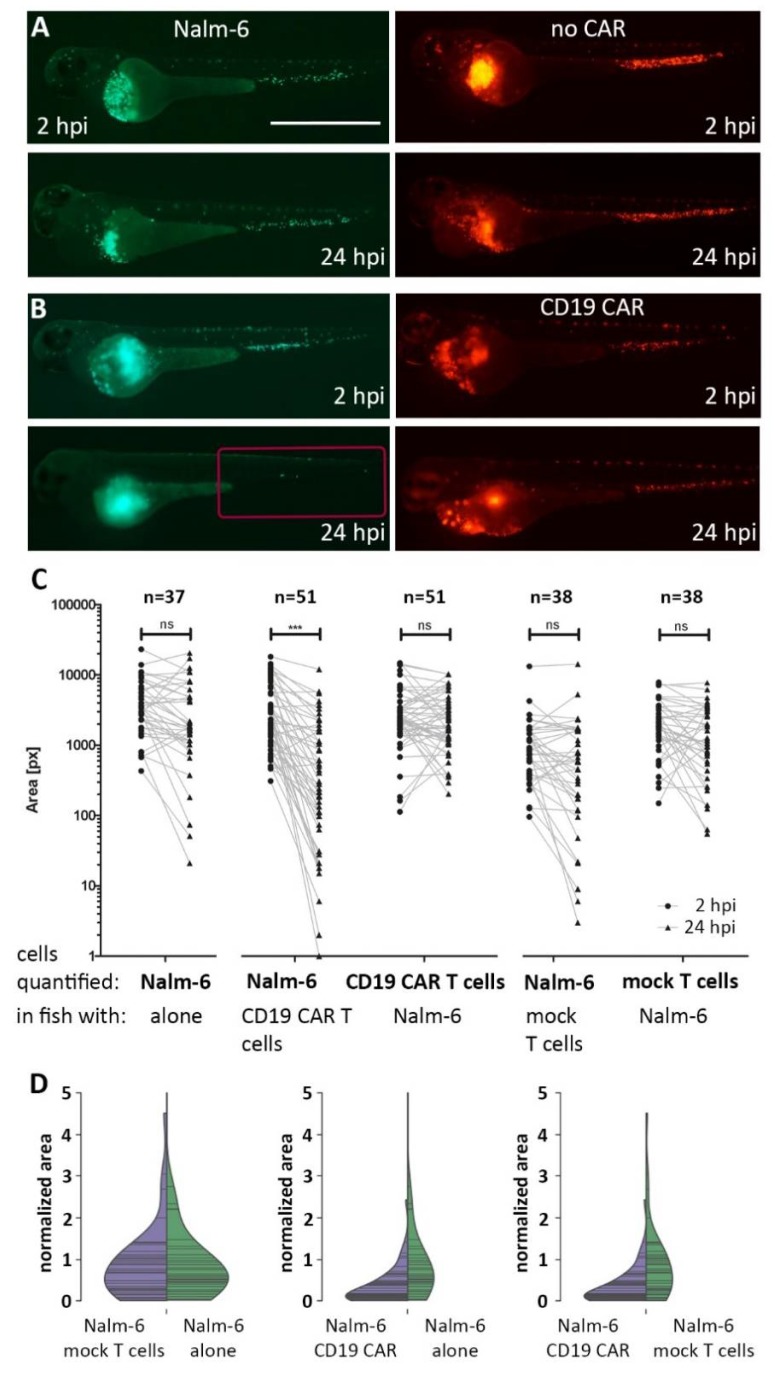
CAR T cell-mediated killing of Nalm-6 cells in zebrafish. Zebrafish embryos were injected with Nalm-6 cells (green) at approximately 48 hpf. Around 2 hours later, either mock T cells (without a CAR) (red cells in (A)) or CD19 CAR T cells (red cells in (B)) were injected and images were recorded within 2 hours and again at 24 hours post injection of T cells. (C) The numbers of Nalm-6 cells and T cells were quantified at 2 hpi and 24 hpi based on the fluorescent area covered by cells in the tail (red box in B) using Fiji. The two time points are connected by a line for each embryo. From left to right: Nalm-6 cells in zebrafish without any T cells; Nalm-6 cells (in zebrafish with CD19 CAR T cells), CD19 CAR T cells (in zebrafish with Nalm-6); Nalm-6 cells (in zebrafish with mock T cells), mock T cells (in zebrafish with Nalm-6) at 2 hpi and 24 hpi. (D) Violin plots normalized to the area covered by fluorescent cells at 2 hpi revealing the change in distribution at 24 hpi. Nalm-6 cells together with mock T cells or alone without T cells show similar distributions at 24 hpi, whereas Nalm-6 injected with CD19 CAR T cells show a reduction compared to Nalm-6 alone or Nalm-6 with mock T cells. Images were recorded on a Zeiss Axio Zoom.V16 fluorescence stereo zoom microscope and rendered with Adobe Photoshop CS6. Scale bar in (A) represents 1 mm.

Acknowledgments
This image is the copyrighted work of the attributed author or publisher, and ZFIN has permission only to display this image to its users. Additional permissions should be obtained from the applicable author or publisher of the image. Full text @ Cancers