IMAGE

Fig 5

ID
ZDB-IMAGE-200406-56
Source
Figures for Wang et al., 2020
Image
Figure Caption

Fig 5 LD cycle is essential for <italic>nr1d1</italic> oscillation.

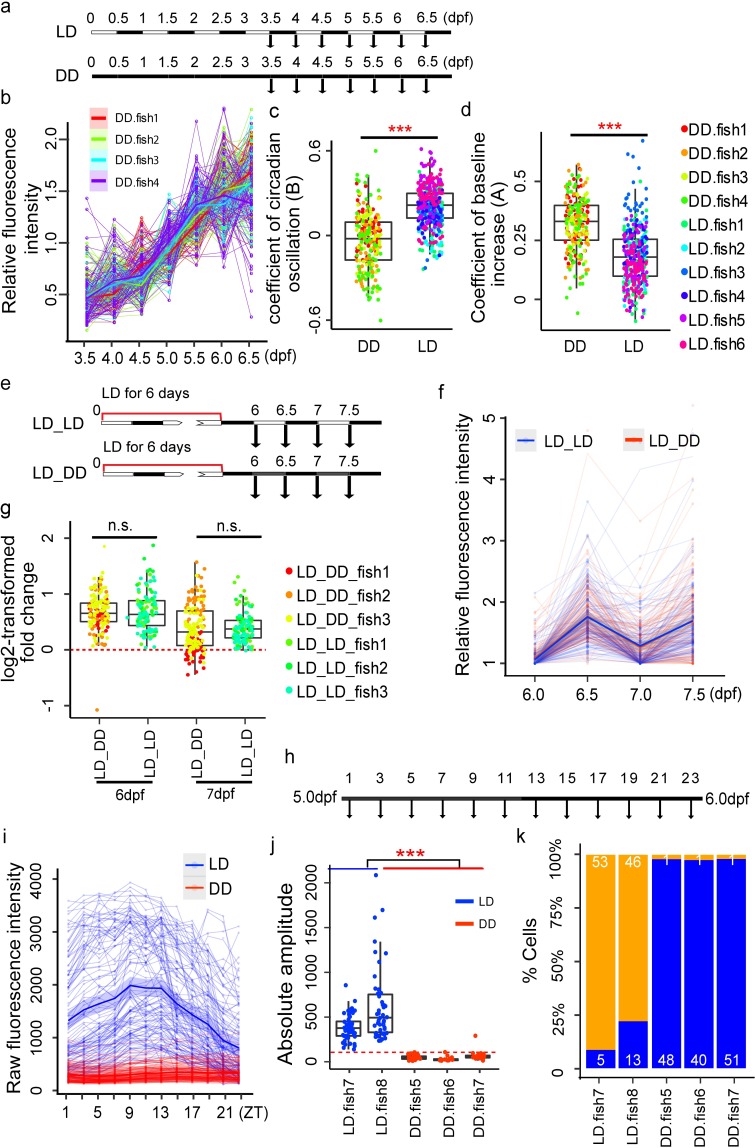
(a) Experimental design to investigate the effect of light on the onset of circadian clock development. (b) Expression patterns of all cells under DD condition during development (four fish). Each thin line represents one cell. Each thick line represents the loess-smoothed curve of all cells in each individual fish. The shaded area shows the 95% confidence level of the smoothed curve. (c) Comparison of oscillating coefficient (B) between LD (six fish) and DD (four fish) cells. Two-tailed Student t test was applied to calculate the levels of significance between the two types of cells. ***P < 0.001. (d) Comparison of developmental coefficient (A) between LD (six fish) and DD (four fish) cells. Two-tailed Student t test was applied to calculate the levels of significance between the two types of cells. ***P < 0.001. (e) Experimental design to examine the single-cell circadian clocks under DD after transferred from LD (LD_DD). (f) Expression patterns of LD_LD (three fish) and LD_DD cells (three fish) from 6.0 to 7.5 dpf. Each thin line represents one cell and each dot represents raw fluorescence intensity. Thick lines represent the loess-smoothed curves for all the LD_DD cells in red and LD_LD cells in blue, respectively. The shaded areas show the 95% confidence level of the smooth curve. (g) Log2-transformed dusk–dawn ratios of VNP fluorescence intensities of all the cells in (f). Each data point represents one cell and the colors correspond to different fish. The red dashed line represents y = 0. n.s. represents no significant difference in dusk–dawn ratios between different time points (two-tailed ANOVA test). (h) Experimental design to examine the expression pattern of DD cells at higher temporal resolution. (i) Expression patterns of LD (two fish) and DD cells (three fish) across one day at 2-hour resolution. Each thin line represents one cell and each dot represents raw fluorescence intensity. Thick lines represent the loess-smoothed curves for all the LD in blue and DD cells in red, respectively. The shaded areas show the 95% confidence level of the smooth curve. (j) Comparison of the absolute amplitudes of LD and DD cells in (i) from JTKcycle. The red dashed line represents y = 100. (k) Percentages of oscillating cells (JTKcycle adjusted P < 0.05 and absolute amplitude >100) in each LD and DD fish. The orange bars represent the percentage of oscillating cells, while the blue bars represent the percentage of non-oscillating cells. The numerical values for panels b, c, d, f, g, i, j, and k were in S1 Data. DD, constant dark; dpf, days postfertilization; LD, light–dark; VNP, Venus-NLS-PEST; ZT, Zeitgeber time.

Acknowledgments
This image is the copyrighted work of the attributed author or publisher, and ZFIN has permission only to display this image to its users. Additional permissions should be obtained from the applicable author or publisher of the image. Full text @ PLoS Biol.