IMAGE

Fig 4

ID
ZDB-IMAGE-200406-53
Source
Figures for Wang et al., 2020
Image
Figure Caption

Fig 4 Circadian dynamics of the pineal gland at higher temporal resolution (two fish).

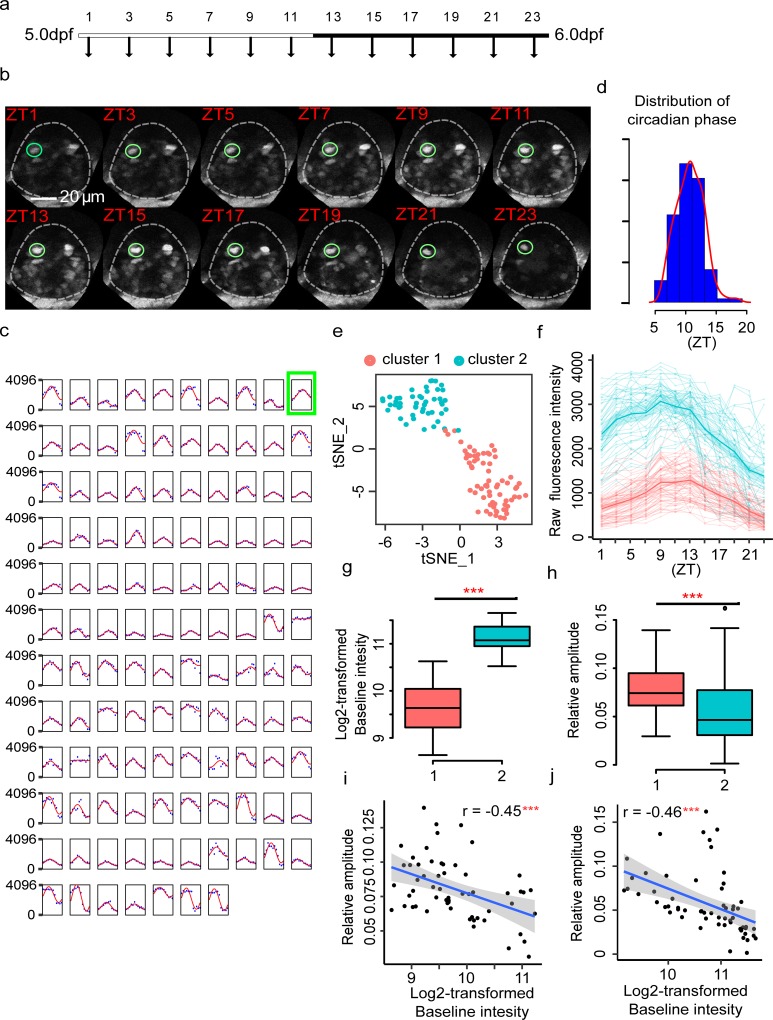
(a) Experimental design to examine the developmental dynamics of nr1d1:VNP expression at higher temporal resolution. (b) Fluorescence images illustrate the tracing of one nr1d1:VNP example cell every 2 hours. (c) Single-cell tracing results of all 117 nr1d1:VNP-positive cells in two zebrafish pineal glands (two fish). The blue dots represent the original fluorescence signals, while the solid red line represents the smoothed curve fitted by the cosine functions. The example cell in (b) is highlighted by a green square. (d) Circadian phase distributions of the 117 nr1d1:VNP-positive cells. (e) t-SNE visualization of the clustering result of the 117 nr1d1:VNP-positive cells. (f) Raw fluorescence intensity traces of the two types of nr1d1:VNP-positive cells in (e). (g and h) The comparison of the baseline expression (g) and relative circadian amplitude (h) between the two types of cells. The colors of the boxes correspond to (e). Two-tailed Student t test was applied to calculate the levels of significance between the two types of cells. ***P < 0.001. (i and j) Scatterplot demonstrates the relationship between baseline intensity and relative oscillation amplitude for fish1 (i) and fish2 (j), respectively. ***Pearson’s correlation P < 0.001. The numerical values for panels c–j are in S1 Data. dpf, days postfertilization; t-SNE, t-distributed stochastic neighbor embedding; ZT, Zeitgeber time.

Acknowledgments
This image is the copyrighted work of the attributed author or publisher, and ZFIN has permission only to display this image to its users. Additional permissions should be obtained from the applicable author or publisher of the image. Full text @ PLoS Biol.