
|
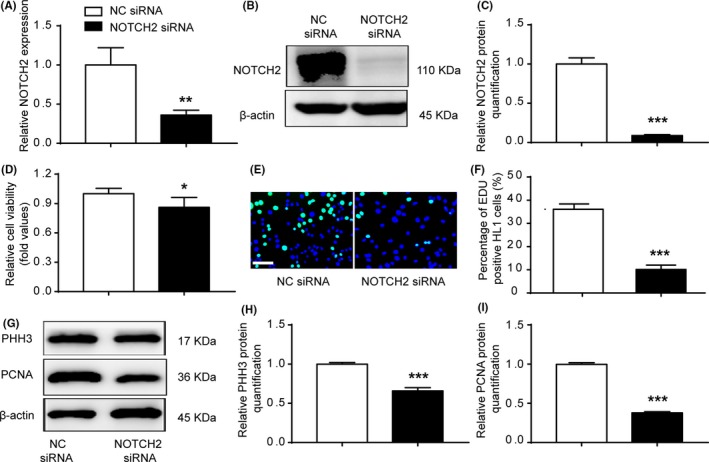
Figure 6
NOTCH2 siRNA inhibited cardiomyocyte proliferation. A‐C, qRT‐PCR and WB were performed in HL1 cells transfected with NOTCH2 siRNA. NOTCH2 siRNA decreased the endogenous NOTCH2 expression. D, Cell viability was examined via CCK‐8 assays. Cells transfected with NOTCH2 siRNA exhibited decreased cell viability compared with the control cells. E and F, EdU incorporation assay of cardiomyocytes. NOTCH2 siRNA decreased EdU incorporation (n > 1000, bar = 50 μm). G, WB analysis of PHH3 and PCNA. H and I, Relative quantification of PHH3 and PCNA protein. The expression of PHH3 and PCNA protein was down‐regulated in the NOTCH2 siRNA group. The data are presented as the mean ± SEM. Statistical significance is shown as *