
|
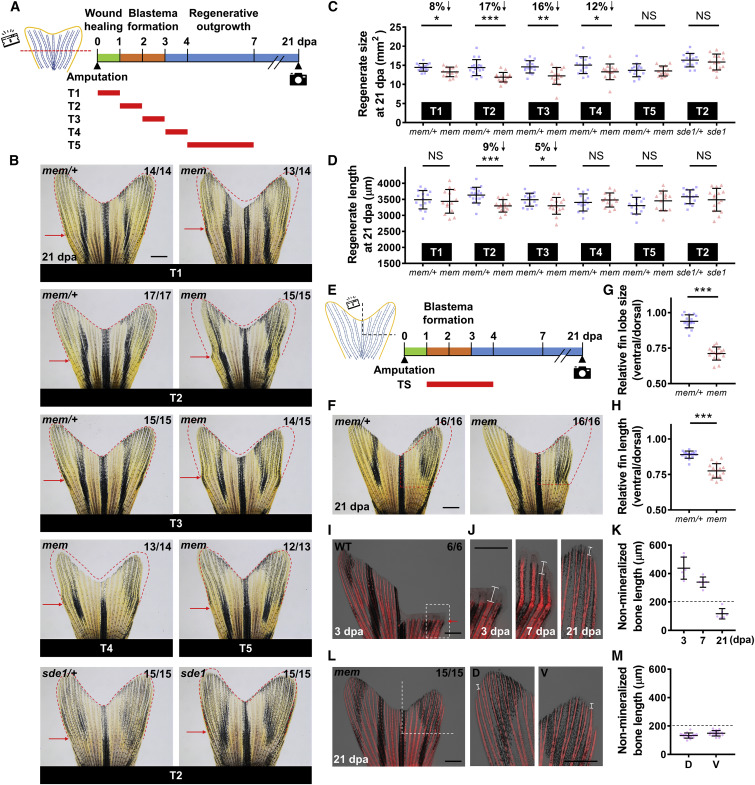
Fig. 2 mem Inactivation within a 48-h Time Window Alters Fin Regenerate Size (A) Schematic timeline of temperature shifts after fin amputation. Green bar indicates the wound healing phase. Orange bar indicates the blastema formation phase. Blue bar indicates the regenerative outgrowth phase. Red bars indicate the period of the heat treatment at the restrictive temperature (33°C). (B) Whole-mount images of mem fin regenerates at 21 dpa with different heat treatments. Red dashed lines depict mem/+ regenerate size with the same treatment scheme to facilitate visual comparison between mem and mem/+. Red arrows indicate amputation plane. Scale bar, 1 mm. (C and D) Measurement of mem fin regenerate size (C) and length (D) at 21 dpa with different heat treatments. The 2nd lateral bony ray from the dorsal side was measured to represent tailfin length in (D) (n = 14 mem/+, 14 mem; 17 mem/+, 15 mem; 15 mem/+, 15 mem; 15 mem/+, 14 mem; 14 mem/+, 13 mem; and 15 sde1/+, 15 sde1; mean ± SD; Student’s t test; ∗∗∗p < 0.001; ∗∗p < 0.01; ∗p < 0.05). (E) Left: illustration of ventral fin lobe amputation. Right: schematic timeline of temperature shifts after fin amputation is shown. Red bar indicates the period of incubation at 33°C. (F) Whole-mount images of mem at 21 dpa after amputation of the ventral fin lobe. Red dashed lines depict a mirrored margin of the contralateral dorsal fin lobe (without amputation). Scale bar, 1 mm. (G and H) Measurement of the relative fin lobe size (G) and fin length (H; ventral/dorsal) in the same animal (n = 16 mem/+, 16 mem; mean ± SD; Student’s t test; ∗∗∗p < 0.001). (I) Whole-mount images of wild-type (WT) fin regenerates at 3 dpa after staining with Alizarin red for calcium deposition. White dashed box indicates the enlarged area in (J). Red arrows indicate amputation plane. Scale bar, 1 mm. (J) Enlarged view of Alizarin red staining image at 3, 7, and 21 dpa. White solid lines mark the length of the non-mineralized portion in bony rays. Images from the same individual are shown at different time points. Scale bar, 1 mm. (K) Measurement of the length of the non-mineralized portion in the second bony ray at 3, 7, and 21 dpa (n = 6; mean ± SD). The 2nd lateral bony ray from the ventral side was measured as a representative. Black dashed line indicates a cutoff value that defines full mineralization of mature bony rays. (L) Whole-mount images of a mem fin regenerate at 21 dpa after staining with Alizarin red. White dashed lines indicate amputated fin regions. Right: enlarged views of the uninjured dorsal (D) and regenerated ventral (V) fin lobes are shown. White solid line marks the length of the non-mineralized bone portion. Scale bars, 1 mm. (M) Measurement of the length of the non-mineralized bone portion at 21 dpa (n = 15; mean ± SD). The 2nd lateral, uninjured bony ray on dorsal fin lobes was measured for comparison. Black dashed line indicates a cutoff value that defines full mineralization in mature bony rays.