
|
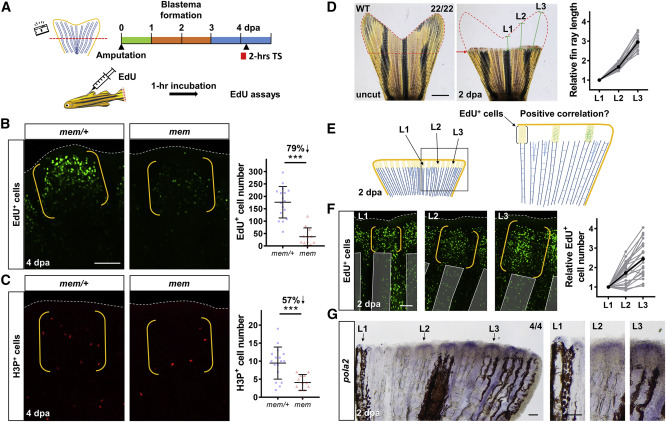
Fig. 4 Active pola2 Is Required for Appropriate Blastemal Proliferation and Encoding of Positional Information in Fin Regenerates (A) Schematic timeline of the 2-h heat treatment at 4 dpa. TS, temperate shift. Green bar indicates the wound healing phase. Orange bar indicates the blastema formation phase. Blue bar indicates the regenerative outgrowth phase. Red bar indicates the period of heat treatment at the restrictive temperature (33°C). Following the heat treatment, EdU was injected intraperitoneally 1 h prior to collection of fin regenerates. (B) Whole-mount EdU staining images of mem fin regenerates at 4 dpa after a 2-h incubation at 33°C. White dashed lines outline the distal edge of the fin. Yellow brackets mark the blastema compartment. Scale bar, 100 μm. Right: quantification of EdU-positive cells in the lateral 2nd bony ray (n = 17 mem/+, 12 mem; mean ± SD; Student’s t test; ∗∗∗p < 0.001). (C) Whole-mount H3P staining images of mem fin regenerate at 4 dpa after a 2-h stay at 33°C. White dashed lines outline the distal edge of the fin. Yellow brackets mark the blastema compartment. Right: quantification analysis of H3P-positive cells in the lateral 2nd bony ray (n = 17 mem/+, 12 mem; mean ± SD; Student’s t test; ∗∗∗p < 0.001). (D) Whole-mount images of WT tailfin taken before amputation and at 2 dpa. Red dashed lines depict tailfin tissues that were removed by the amputation. Red arrows indicate amputation plane. Green solid lines indicate individual bony ray lengths to be regenerated upon completion of regeneration; L1, the 9th lateral bony ray from the ventral side; L2, the 6th lateral bony ray; L3, the 3rd lateral fin ray. Scale bar, 1 mm. L2 and L3 bony ray lengths were normalized to the L1 value from the same individual (n = 22; gray dots mark values from each fin tissues). Black dots denote the mean value. (E) Illustration depicting a possible model for the relative number of proliferating blastema cells at 2 dpa. The proliferating cell number at 2 dpa may be predictive of the bony ray lengths to be regenerated. (F) Whole-mount EdU staining of L1, L2, and L3 regenerates in WT at 2 dpa. White dashed lines outline the distal edge of the fin. Yellow brackets mark a single blastema compartment. Transparent gray bars mark bony rays. Images shown are from the same individual. Scale bar, 100 μm. Quantification of EdU+ cell number in L1, L2, and L3 bony rays is shown. The number of blastema cells in L2 and L3 was normalized to the number in L1 from the same individual (n = 22; gray dots mark values from each fin tissue). Black dots denote the mean value. (G) Whole-mount RNA in situ hybridization of pola2 in a representative WT fin regenerate at 2 dpa (n = 4). Right: enlarged view of L1, L2, and L3 is shown. Scale bars, 100 μm. See also Figure S3.