
|
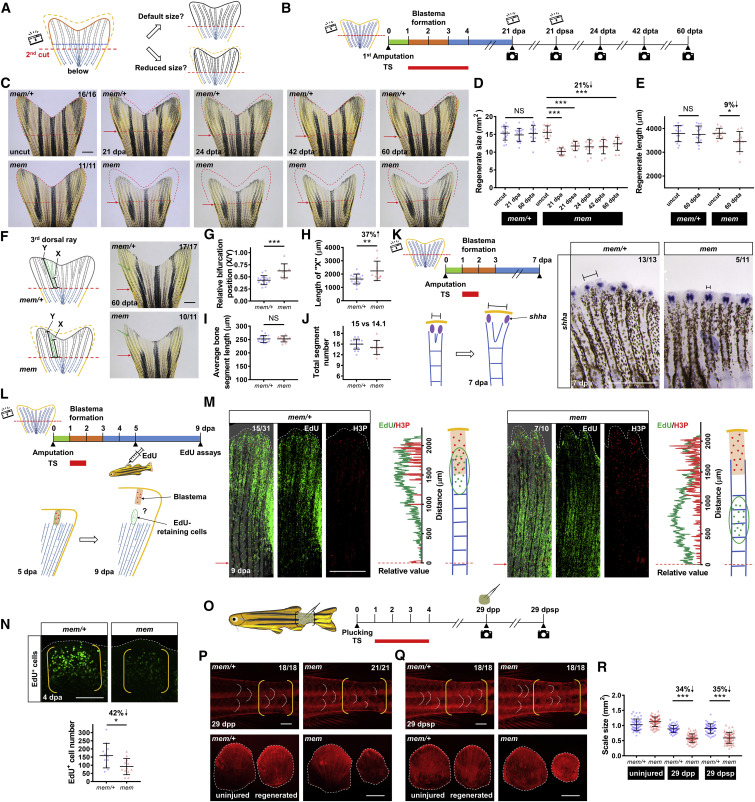
Fig. 5 Reprogrammed Positional Information in mem Regenerates Is Transferable to Subsequent Cycles of Injury/Regeneration (A) Illustration depicting possible outcomes for fin regenerate size after a second amputation. After development of a miniature tailfin following the first amputation, a second amputation below the first amputation plane may either restore default fin size or recall the reprogrammed size. Blue dashed line indicates the first amputation plane. Red dashed lines indicate the second amputation plane. (B) Schematic timeline of temperature shifts after fin amputation. A second amputation was performed at approximately one bone segment below the first amputation plane at 21 dpa. A third amputation was performed at approximately one bone segment below the second amputation plane at 21 days post-second amputation (dpsa). Green bar indicates the wound healing phase. Orange bar indicates the blastema formation phase. Blue bar indicates the regenerative outgrowth phase. Red bar indicates the period of incubation at the restrictive temperature (33°C). dpta, days post-third amputation. (C) Whole-mount images of mem fin regenerates. Images of uncut, 21 dpa, 24 dpta, 42 dpta, and 60 dpta of the same animals are shown across sequential amputations. Red dashed lines depict tailfin region removed by the first amputation to facilitate visual comparison across different time points. Red arrows indicate amputation plane. Scale bar, 1 mm. (D and E) Measurement of mem fin regenerate size (D) and length (E) at different time points (n = 16 mem/+, 11 mem; mean ± SD; Student’s t test; ∗∗∗p < 0.001; ∗p < 0.05). (F) Illustration depicting bifurcation points in the 3rd dorsal bony ray. X indicates the length between the amputation plane and the first bifurcation point distal to the plane; Y indicates total regenerate length. Whole-mount images of mem fin regenerates at 60 dpta. Green arrows indicate the first bifurcation point. Red arrows indicate the amputation plane. Scale bar, 1 mm. (G–J) Measurements were made of the (G) relative position of the first bifurcation point (X/Y), (H) the absolute length of “X,” (I) the average length of bone segments (Y/number of segments), and (J) total segment number (n = 17 mem/+, 10 mem; mean ± SD; Student’s t test; ∗∗∗p < 0.001; ∗∗p < 0.01). (K) Schematic timeline of temperature shifts after fin amputation. (Below) Illustration depicting epithelial domains of shha during regeneration is shown. Right: whole-mount RNA in situ hybridization in mem/+ and mem fin regenerates at 7 dpa (n = 13 mem/+, 11 mem) is shown. Black solid lines mark the distance between two separated shha signals in each bony ray. Scale bar, 0.5 mm. (L) Schematic timeline of temperature shifts after fin amputation. (Below) Illustration depicting labeling and tracking of EdU-retaining cells is shown. A brief 24-h inactivation of pola2 was performed at 1 dpa. EdU was injected intraperitoneally at 5 dpa to label blastema cells. Tailfin tissues were collected at 9 dpa for EdU assays and H3P immunostaining. H3P signal was used as a marker of the blastemal zones at 9 dpa. (M) Whole-mount EdU and H3P immunostaining of mem/+ and mem fin regenerates at 9 dpa. White dashed lines outline the distal edge of the fin. Red arrows and dashed lines indicate the amputation plane. Relative fluorescence value distribution of EdU-retaining cells and H3P-positive cells was assessed along the proximodistal axis of the same bony ray (n = 31 mem/+, 10 mem). Scale bar, 0.5 mm. (N) Whole-mount EdU staining of mem miniature fin regenerates at 4 dpa. White dashed lines outline the distal edge of the fin. Yellow brackets mark the blastema compartment. Scale bar, 100 μm. Bottom: quantification analysis of EdU-positive cells in the lateral 2nd bony ray is shown (n = 12 mem/+, 12 mem; mean ± SD; Student’s t test; ∗p < 0.05). (O) Illustration depicting scale plucking experiment; 15–20 scales were removed from each adult individual with surgical forceps. Schematic timeline of temperature shifts after scale plucking is shown. dpp, days post plucking; dpsp, days post-second plucking. (P) Top: whole-mount images of mem scale regenerates at 29 dpp after staining with Alizarin red. White dashed lines indicate posterior margins of three representative scales in the plucked and control regions. Yellow brackets mark regions of scale plucking on the fish body surface. Scale bar, 1 mm. Bottom: images of plucked scales are shown. White dashed lines indicate outline of the scales. Scale bar, 0.5 mm. (Q) Top: whole-mount images of mem scale regenerates at 29 dpsp after staining with Alizarin red. White dashed lines indicate posterior margins of three representative scales in the plucked and control regions. Yellow brackets mark regions of scale plucking on the fish body surface. Scale bar, 1 mm. Bottom: images of plucked scales are shown. Scale bar, 0.5 mm. (R) Measurement of mem and mem/+ scale size at 29 dpp and 29 dpsp. Three scales were removed from each individual for imaging and quantification (n = 55 mem/+, 66 mem for uninjured scales; n = 55 mem/+, 63 mem for the first regenerated scales; n = 55 mem/+, 58 mem for the second regenerated scales; mean ± SD; Student’s t test; ∗∗∗p < 0.001). See also Figures S4, S5, and S6.