
|
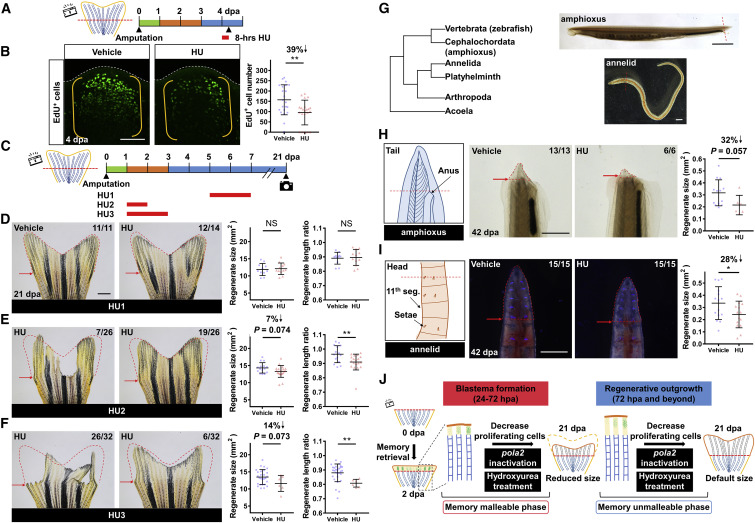
Fig. 6 Transient Inhibition of DNA Synthesis and Blastemal Cell Proliferation Impacts Positional Memory in Diverse Animal Species (A) Schematic timeline of hydroxyurea (HU) treatment after fin amputation. Green bar indicates the wound healing phase. Orange bar indicates the blastema formation phase. Blue bar indicates the regenerative outgrowth phase. Red bar indicates the period of HU treatment. (B) Whole-mount EdU staining of WT fin regenerates at 4 dpa after an 8-h treatment with HU. White dashed lines outline the distal edge of the fin. Yellow brackets mark the blastema compartment. Scale bar, 100 μm. Right: quantification of EdU-positive cells in the lateral 2nd bony ray is shown (n = 22 mem/+, 22 mem; mean ± SD; Student’s t test; ∗∗p < 0.01). (C) Schematic timeline of HU treatment after fin amputation. Red bars indicate the periods of HU treatment. (D–F) Whole-mount images of HU-treated WT tailfin regenerate at 21 dpa; (D) HU1, (E) HU2, and (F) HU3 treatment. Red dashed lines depict average regenerate size in vehicle-treated animals to facilitate visual comparison. Red arrows indicate amputation plane. Scale bar, 1 mm. Right: quantification of regenerate size and length ratio (i.e., regenerated fin length versus uninjured fin length of the same animal) at 21 dpa (n = 11 vehicle, 12 HU for HU1; 15 vehicle, 19 HU for HU2; 29 vehicle, 6 HU for HU3; mean ± SD; Student’s t test; ∗∗p < 0.01). Only tailfin tissues displaying no regeneration block after HU treatment were included in the analysis. (G) A phylogenetic tree of relevant animals. Zebrafish, amphioxus, and annelids were examined in this study. Right: red dashed lines indicate amputation planes in amphioxus and annelids. Scale bars, 1 mm. (H) Illustration depicting amputation plane in amphioxus. Tail amputation was performed posterior to the anus. Middle: whole-mount images of amphioxus tail regenerates at 42 dpa are shown. Red dashed lines depict the tail regenerates. Red arrows indicate amputation plane. Scale bar, 1 mm. Right: quantification analysis of the tail regenerate size is shown (n = 13 vehicle, 6 HU; mean ± SD; Student’s t test). (I) Illustration depicting amputation plane in annelids. Head amputation was performed at the 9th segment, which was recognized by the absence of setae on the ventral side of the 11th segment. Middle: Whole-mount images of annelid head regenerates at 42 dpa are shown. Red dashed lines depict the head regenerates. Red arrows indicate amputation plane. Scale bar, 0.5 mm. Right: quantitative analysis of the head regenerate size is shown (n = 15 vehicle, 15 HU; mean ± SD; Student’s t test; ∗p < 0.05). (J) Preliminary model for regulation of positional information.