
|
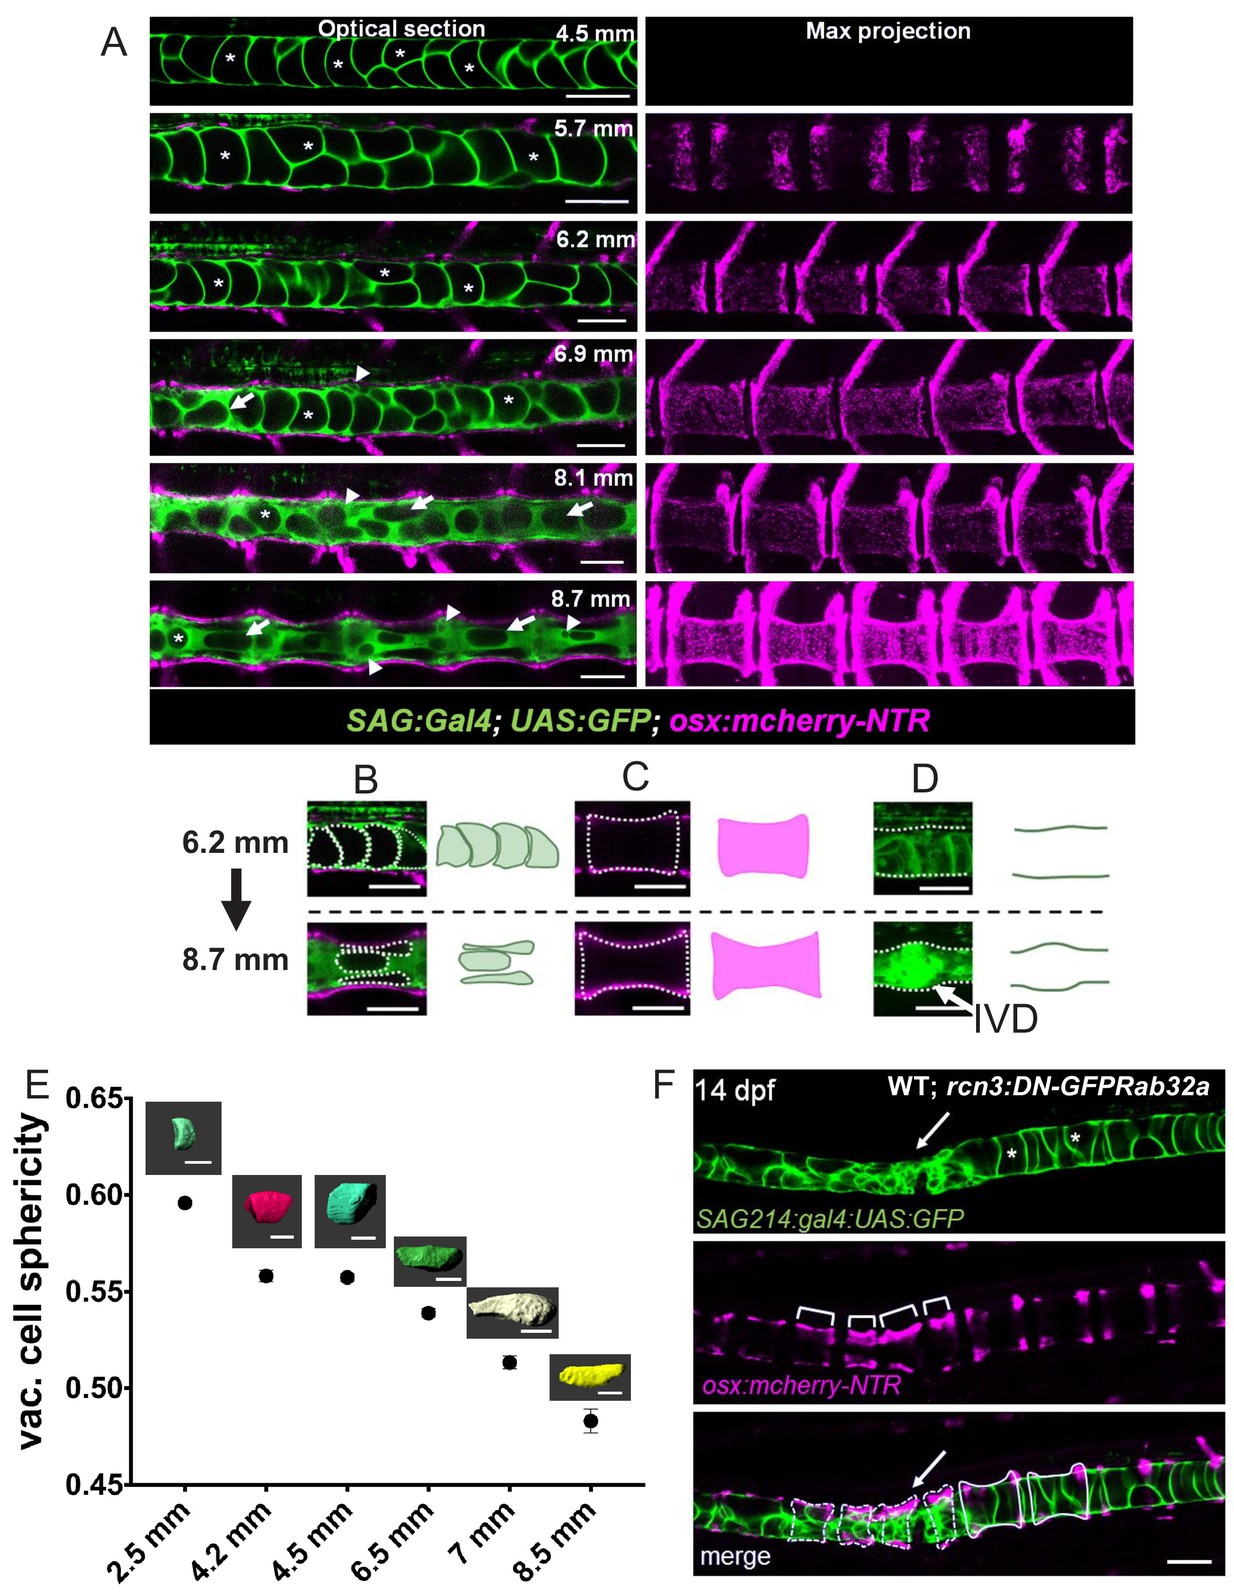
Fig. 6
Notochord vacuoles absorb compressive vertebral bone growth.
( A) Optical sections (left panels) of a live confocal time course during spine formation in WT fish expressing GFP in the vacuolated cells of the notochord and mCherry-NTR in osteoblasts. Asterisks mark the lumen of large vacuoles. Arrows point to vacuoles that re-orientate as they are being squeezed by the growing bone. Maximum intensity projection (right panel) of osteoblast recruitment during bone development. The indentations in the notochord result from concentric bone growth. n = 5, 8, 3, 3, 3, 2 animals respectively. ( B–D) Schematic depicting the shape changes that occur in vacuoles ( B), centra ( C), and the IVD ( D) during vertebral growth between the standard-length stages 6.2 mm and 8.7 mm. Arrowheads point to areas of the notochord with fragmented vacuoles. Arrows indicate vacuoles undergoing shape change. Asterisks mark intact vacuoles. ( E) Average sphericity of vacuolated cells decreases during notochord development and spine formation stages. Examples of cellular shapes are illustrated above each time point on the graph. Scale bar = 50 µm. ( F) Live confocal image of a 14 dpf larva expressing DN-GFP-Rab32a mosaically in the notochord. n = 4 animals. Brackets mark centra. Dotted lines outline malformed centra. Solid lines outline normal centra. Tg(SAGFF214A:gal4); Tg(UAS:GFP); Tg(osx:NTR-mCherry). Scale bars are 100 µm.