
|
Fig. 3
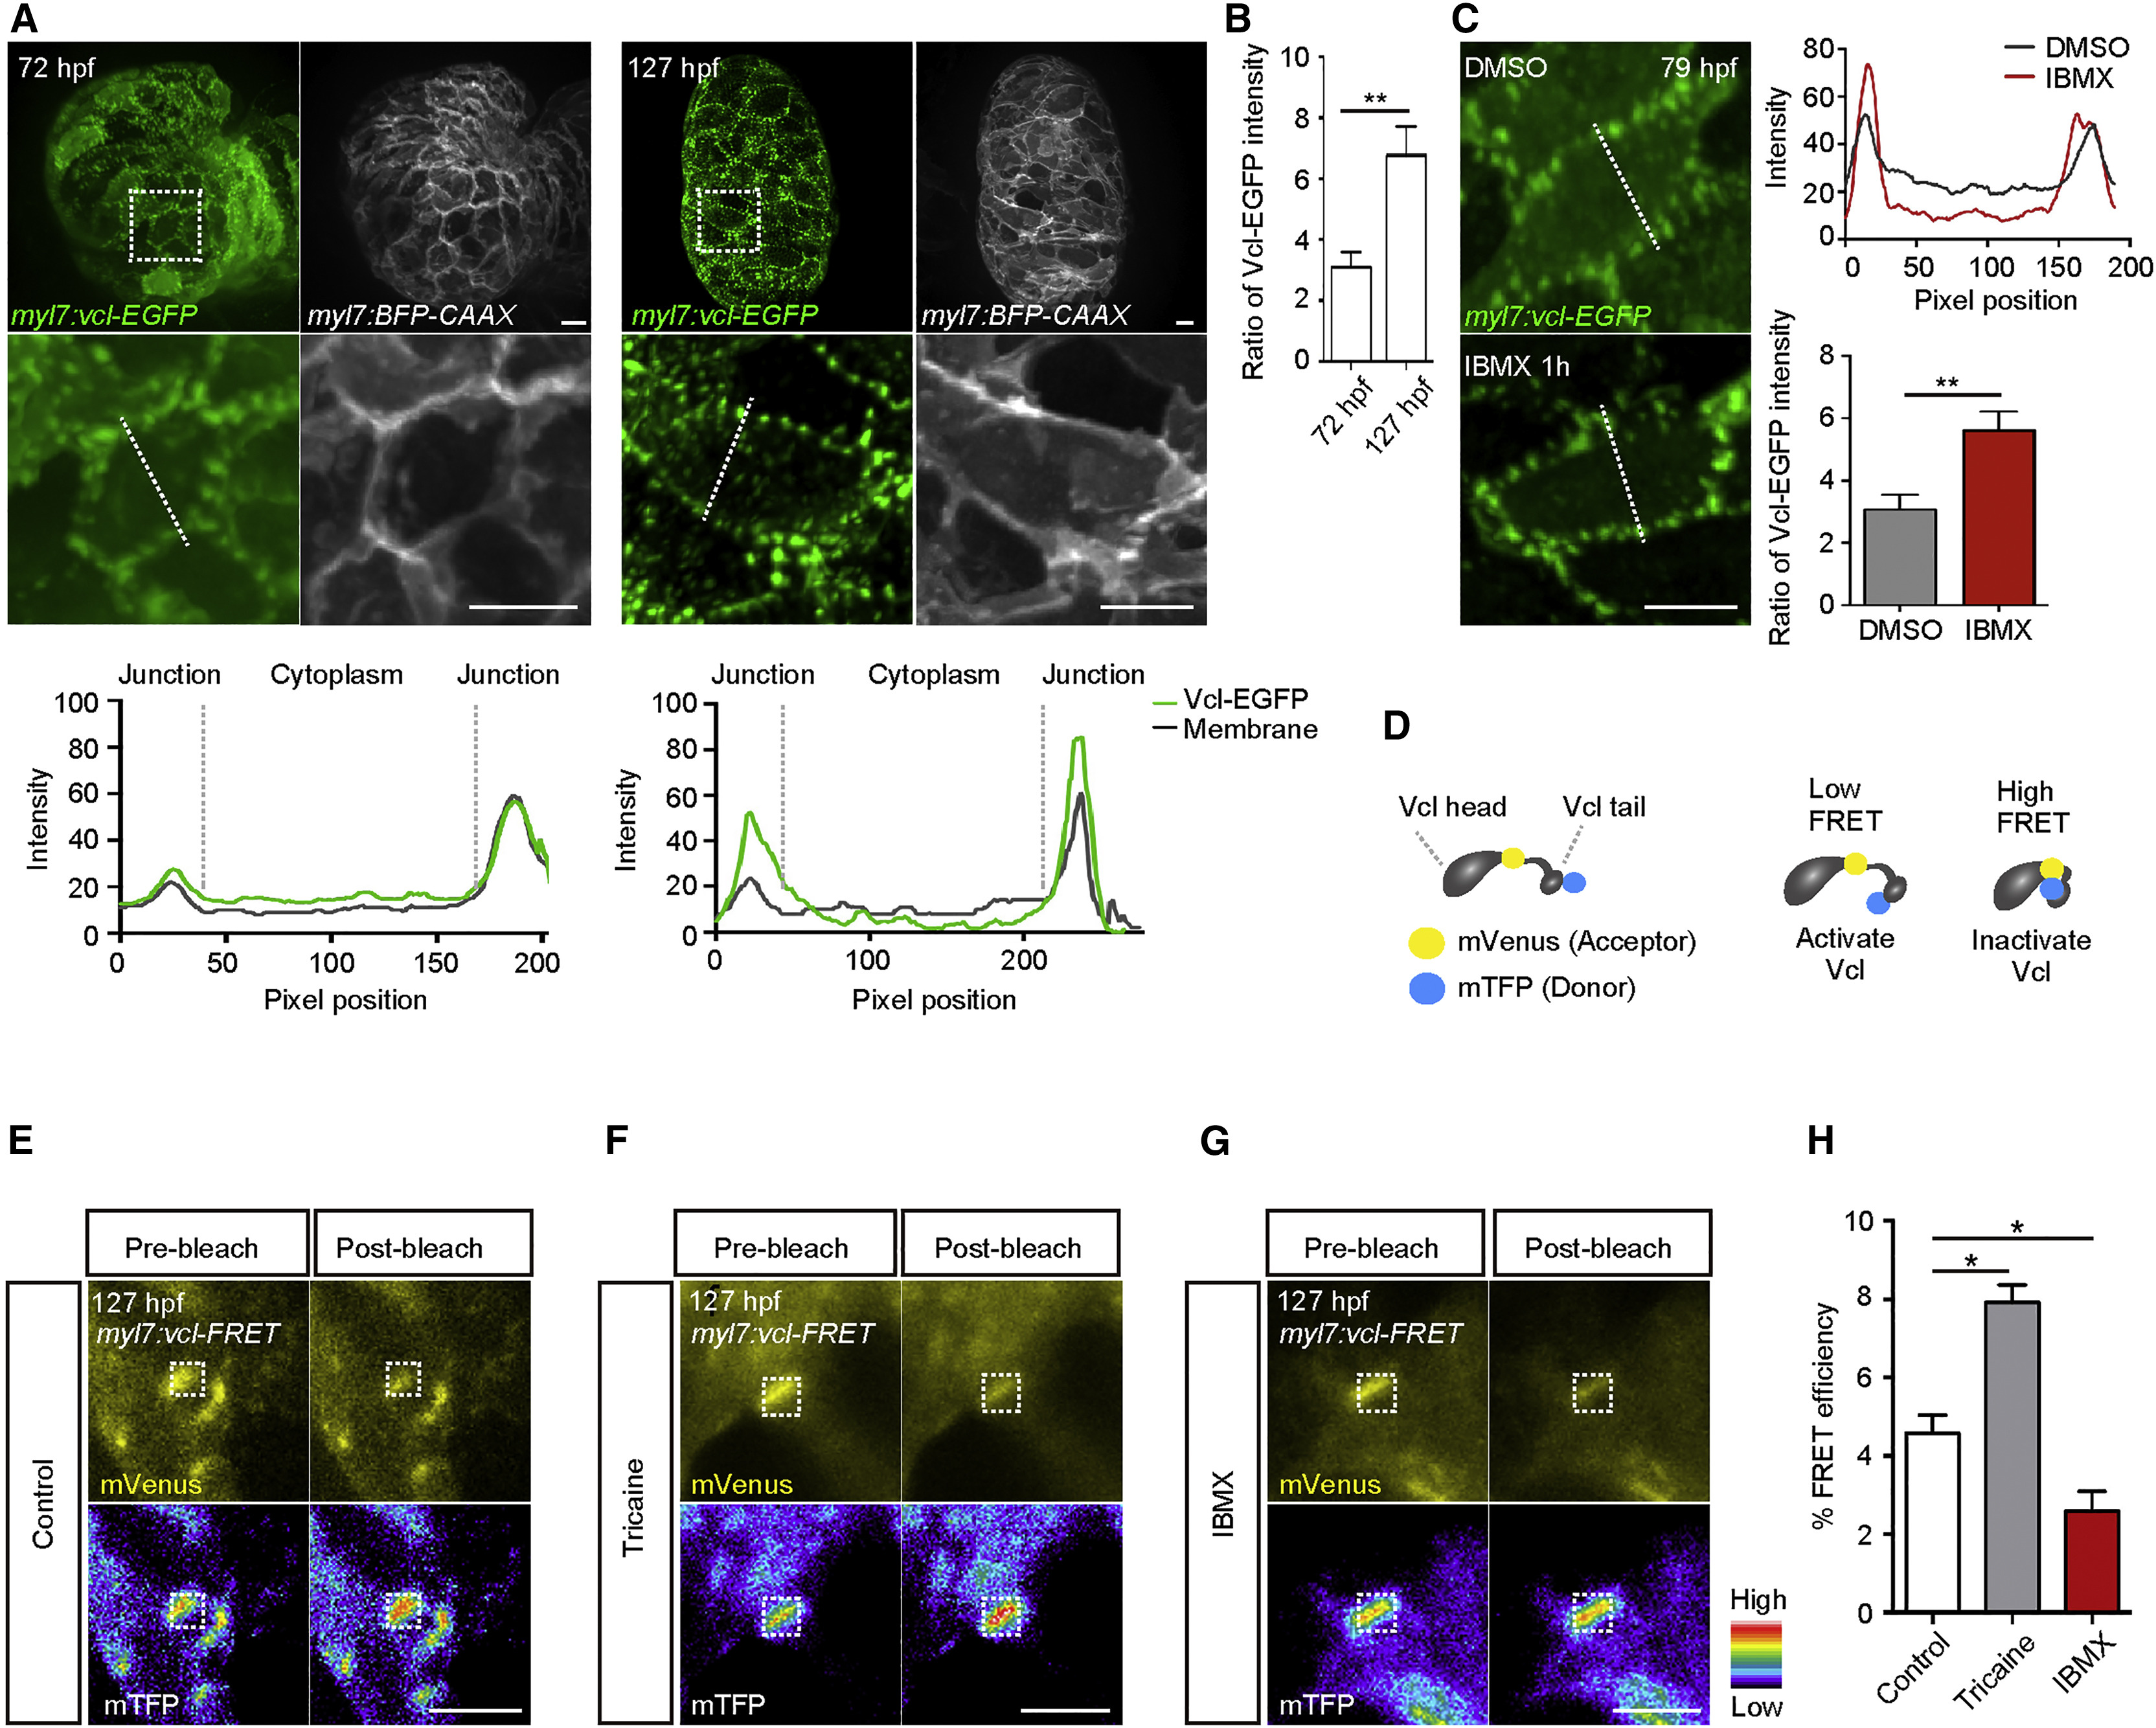
Cardiac Contractility Regulates VCL Localization and Activation
(A) 3D images of 72 and 127 hpf hearts; fluorescence intensities measured along white dashed lines.
(B) Ratio of 72 and 127 hpf ventricular Vcl-EGFP intensity in cell-cell junctions compared to that in the cytoplasm (n = 20 CMs).
(C) 3D images of 79 hpf Tg(myl7:vcl-EGFP) ventricles treated with DMSO or IBMX; Vcl-EGFP intensity measured along white dashed lines; ratio of Vcl-EGFP intensity in cell-cell junctions compared to that in the cytoplasm (n = 20 CMs).
(D) Schematic of the Vcl activation FRET biosensor (Vcl-FRET).
(E–G) FRET measurement in 127 hpf Tg(myl7:vcl-FRET) ventricles immediately after cardiac arrest (E), at 15 min after starting tricaine (F) or IBMX (G) treatment; white boxes outline photobleaching region.
(H) Percentage of FRET efficiencies (n = 20 ventricles per experiment). Error bars, SEM. ∗p < 0.05 and ∗∗p < 0.001 by ANOVA followed by Tukey’s HSD test. Scale bars, 10 μm in (A) and (C); 5 μm in (E)–(G).
Reprinted from Developmental Cell, 51(1), Fukuda, R., Gunawan, F., Ramadass, R., Beisaw, A., Konzer, A., Mullapudi, S.T., Gentile, A., Maischein, H.M., Graumann, J., Stainier, D.Y.R., Mechanical Forces Regulate Cardiomyocyte Myofilament Maturation via the VCL-SSH1-CFL Axis, 62-77.e5, Copyright (2019) with permission from Elsevier. Full text @ Dev. Cell