
Image
|
Figure Caption
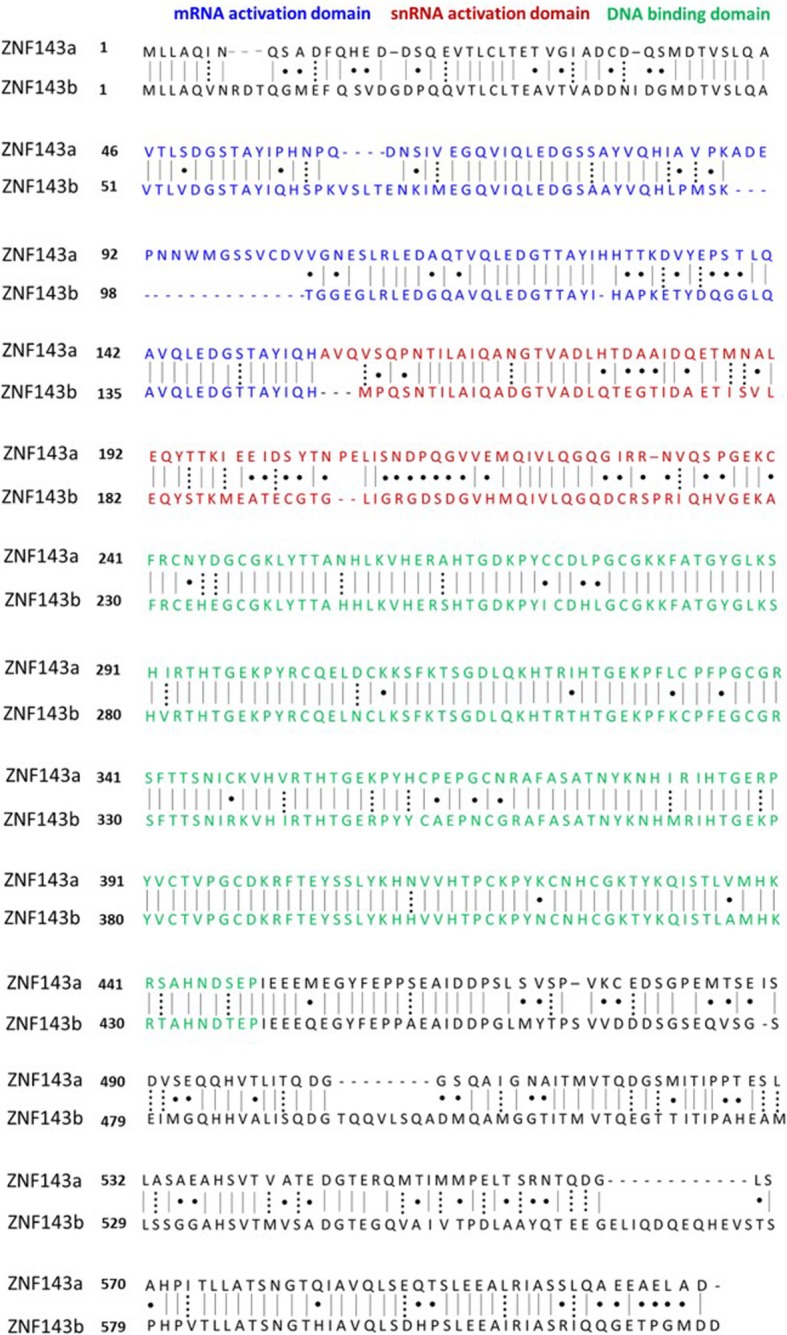
Fig. 1
Amino acid sequence alignment of zebrafish ZNF143a vs. ZNF143b. Protein sequences of ZNF143a and ZNF143b were aligned with the
Acknowledgments
This image is the copyrighted work of the attributed author or publisher, and
ZFIN has permission only to display this image to its users.
Additional permissions should be obtained from the applicable author or publisher of the image.
Full text @ BMC Mol Cell Biol