
Image
|
Figure Caption
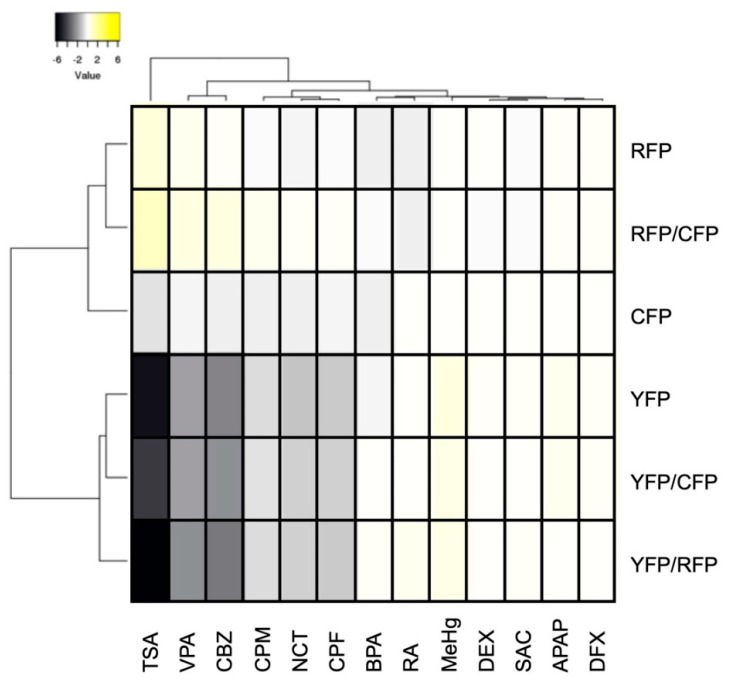
Figure 5
Hierarchical clustering of chemicals based on their effects on Cerulean (CFP), mCherry (RFP), and mCitrine (YFP) expression in triple-Tg zebrafish. The normalized score of six fluorescence parameters (CFP, RFP, YFP, RFP/CFP, YFP/CFP, and YFP/RFP) from triple-Tg zebrafish exposed to chemicals at their MTC from 12 hpf to 5 dpf were subjected to hierarchical clustering using Manhattan distance with average linkage.
Acknowledgments
This image is the copyrighted work of the attributed author or publisher, and
ZFIN has permission only to display this image to its users.
Additional permissions should be obtained from the applicable author or publisher of the image.
Full text @ Pharmaceuticals (Basel)