
Image
|
Figure Caption
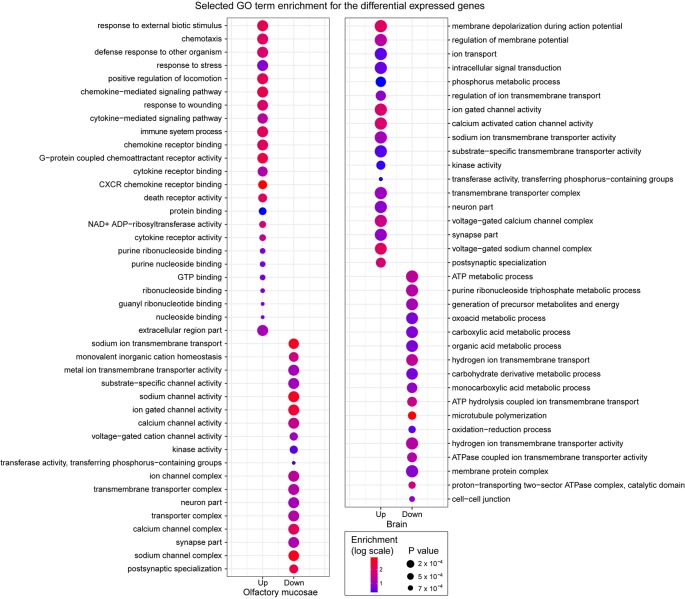
Figure 3
Selected GO term enrichment for the genes identified as differentially expressed in the olfactory mucosae and brain of zebrafish. The enrichment values are indicated in colored scale and p values are indicated with different size.
Acknowledgments
This image is the copyrighted work of the attributed author or publisher, and
ZFIN has permission only to display this image to its users.
Additional permissions should be obtained from the applicable author or publisher of the image.
Full text @ Front Genet