IMAGE

FIGURE 3

ID
ZDB-IMAGE-200112-13
Antibodies
Source
Figures for Zhuang et al., 2019
Image
Figure Caption

FIGURE 3

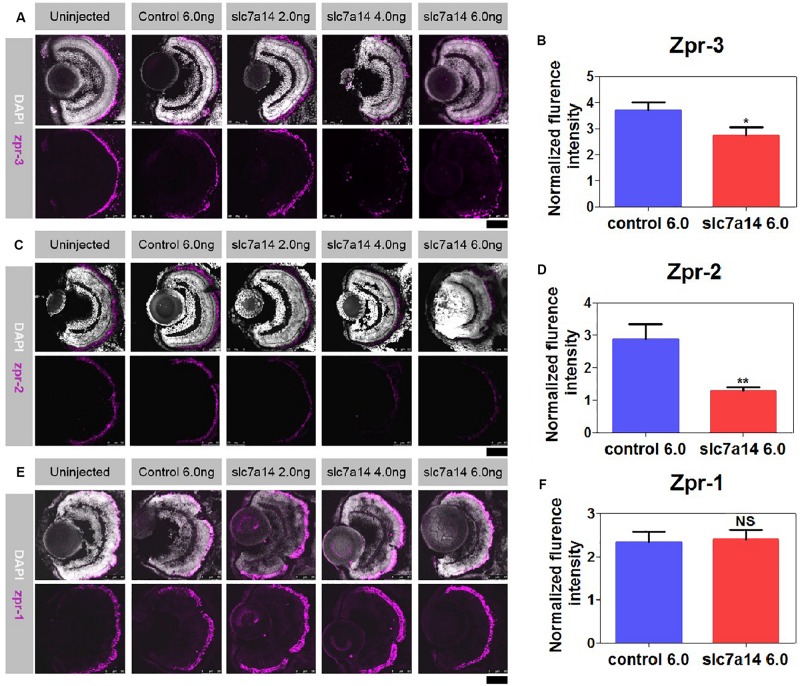
Immunostaining of zpr-1, zpr-2, and zpr-3 in slc7a14-deficient morphants. (A) In the peripheral retina, the high-dose slc7a14-MOs led to sharp reductions in zpr-3. Weaker fluorescence signals were detected in the high-MO dose groups (slc7a14 4.0 ng and slc7a14 6.0 ng) than in the control group. (B) Statistical results for zpr-3 (n = 10 for each group). (C) The high-dose slc7a14-MOs led to significant reductions in zpr-2. There were few fluorescence signals in the peripheral retina in the high-MO dose group (slc7a14 6.0 ng). The RPE in the low-MO dose group (slc7a14 2.0 ng) was relatively normal compared to that in the wild-type group and control group. (D) Statistical results for zpr-2 (n = 10 for each group). (E) No significant changes were found in cone photoreceptors. (F) Statistical results for zpr-1 (n = 5 for each group). Scale bar = 50 μm. Bar plots were shown as the mean ± s.e.m. T-test was performed between the two groups. P < 0.05, ∗∗P < 0.01.

Figure Data
Acknowledgments
This image is the copyrighted work of the attributed author or publisher, and ZFIN has permission only to display this image to its users. Additional permissions should be obtained from the applicable author or publisher of the image. Full text @ Front Cell Dev Biol