IMAGE

Figure 5

ID
ZDB-IMAGE-200101-13
Source
Figures for Zhang et al., 2019
Image
Figure Caption

Figure 5

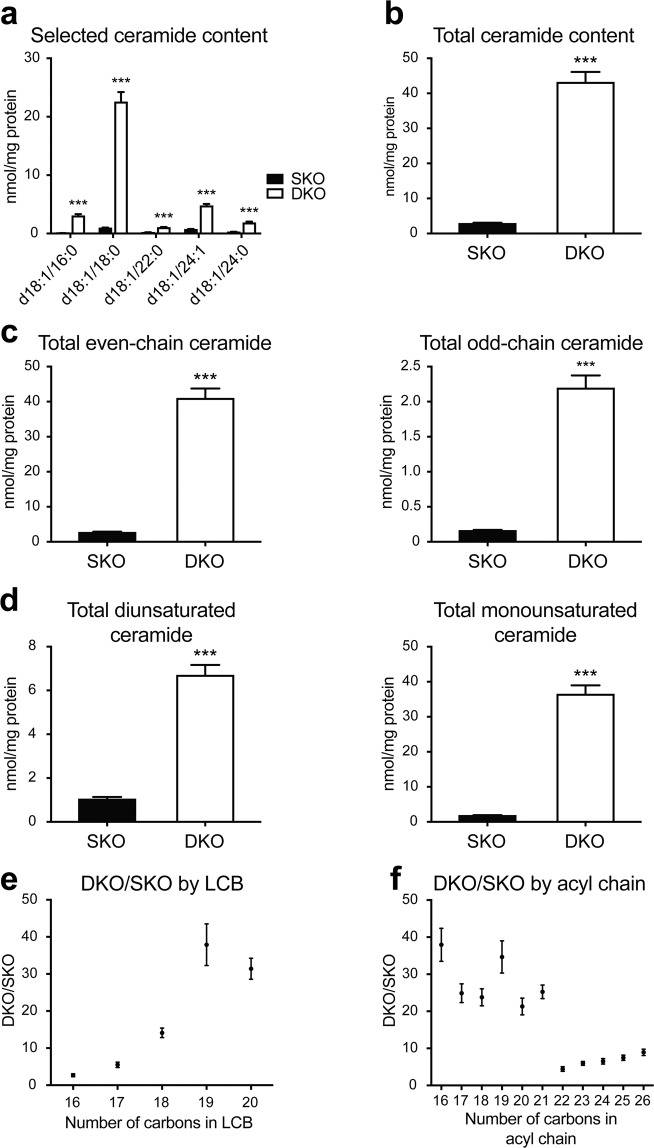
Altered ceramide distribution in Farber disease zebrafish. (a) Quantification for selected ceramides from 3.75-month DKO and SKO zebrafish brains (see Table S4 for quantification of additional ceramide species). (b) Total ceramide content in 3.75-month DKO and SKO zebrafish brains. (c) Total ceramide content by even and odd carbon number. Even: even number of carbons in both acyl chain and LCB; odd: odd number of carbons in acyl chain and/or LCB. (d) Total ceramide content by degrees of unsaturation. Monounsaturated ceramide: one double bond in LCB; diunsaturated ceramide: one additional double bond relative to monounsaturated species. (e) DKO/SKO fold change by LCB length. (f) DKO/SKO fold change by acyl chain length. Student t-test, SEM, n = 4 per group. Representative data from two independent experiments are shown ***p < 0.001.

Figure Data
Acknowledgments
This image is the copyrighted work of the attributed author or publisher, and ZFIN has permission only to display this image to its users. Additional permissions should be obtained from the applicable author or publisher of the image. Full text @ Sci. Rep.