IMAGE

Figure 4

ID
ZDB-IMAGE-191230-935
Source
Figures for Cheng et al., 2019
Image
Figure Caption

Figure 4 Knockdown of pparγ does not block ciglitazone-induced toxicity at 24 hpf.

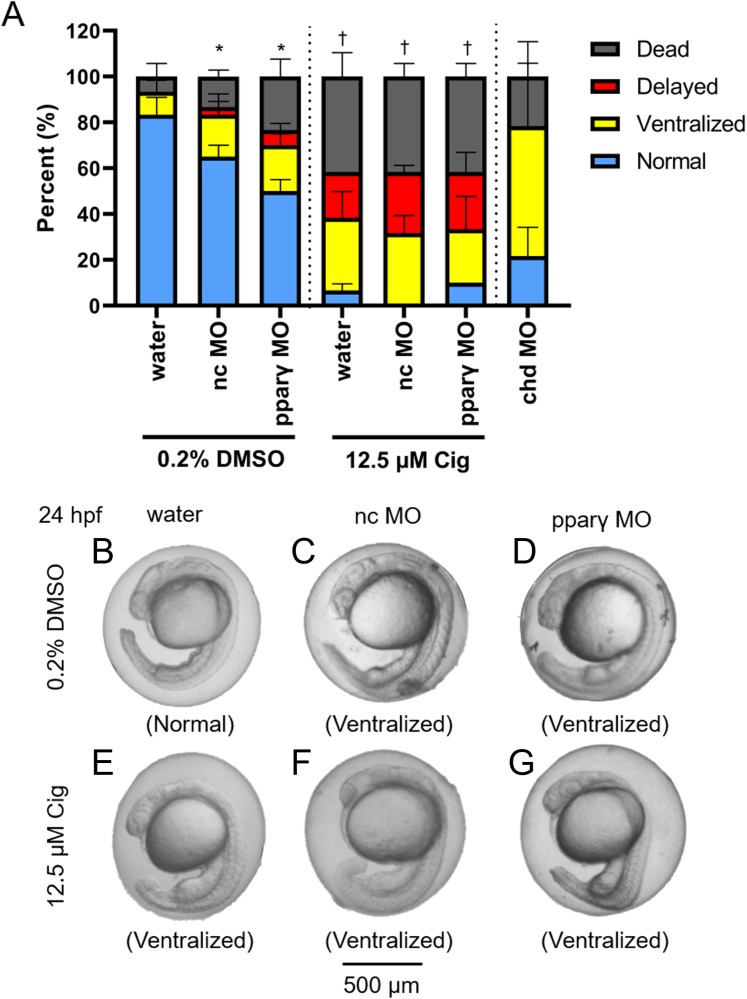
Mean (± standard deviation) percent of normal, ventralized, delayed, or dead embryos following injection of nc-MOs or pparγ-MOs at 0.75 hpf and exposure from 4 to 24 hpf to vehicle (0.2% DMSO) or 12.5 µM ciglitazone (Cig) (N = 60 embryos per treatment). Asterisk (*) denotes a significant difference (p < 0.05) in the percent of normal embryos relative to within-treatment water-injected controls (p < 0.05). Cross (†) denotes a significant difference (p < 0.05) in the percent of normal embryos relative to within-MO vehicle (0.2% DMSO) controls. chd-MO was used as a positive control for ventralization (A). Representative images of nc-MO- and pparγ-MO-injected embryos exposed to either vehicle (0.2% DMSO) or 12.5 µM Cig at 24 hpf (B–G).

Figure Data
Acknowledgments
This image is the copyrighted work of the attributed author or publisher, and ZFIN has permission only to display this image to its users. Additional permissions should be obtained from the applicable author or publisher of the image. Full text @ Peer J.