IMAGE

Figure 1

ID
ZDB-IMAGE-191230-887
Antibodies
Source
Figures for Manchanda et al., 2019
Image
Figure Caption

Figure 1

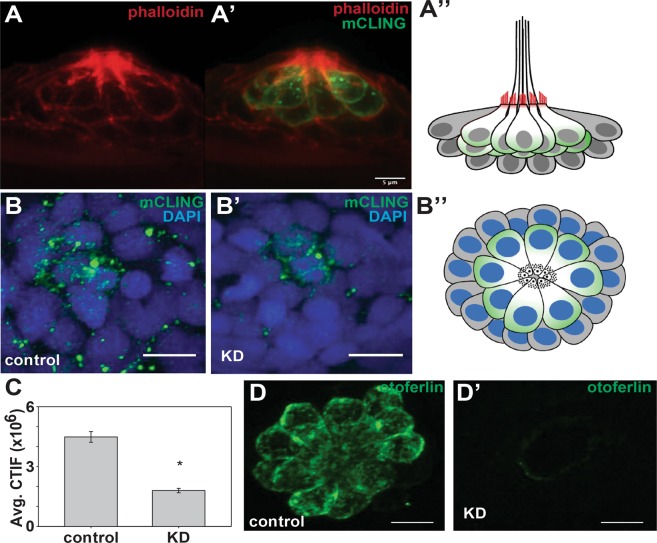
Depletion of otoferlin results in reduced hair cell vesicle recycling. (AA’) Representative confocal images of 96 hpf (A) phalloidin stained neuromasts and (A’) phalloidin and mCLING stained neuromast viewed laterally. (A”) A diagram of a neuromast viewed laterally, with phalloidin stained actin denoted in red, and mCLING loaded hair cells denoted in green. Support cells are depicted in grey. (BB”) Representative confocal images of control morpholino injected (B) and otoferlin morphant injected (B’) lateral line neuromasts labeled with DAPI (blue) and mCLING (green) of mCLING incubation at room temperature. (B”) A diagram of a neuromast in the same orientation as B, B’, with DAPI denoted in blue, and mCLING loaded hair cells denoted in green. Support cells are depicted in grey. (C). Quantification of average mCLING dye associated with neuromasts of negative control injected and morphant zebrafish (t-test, p < 0.001). N = 6 larvae, 3–6 neuromasts per larvae for both negative control and morphant. (DD’) Representative images of lateral line neuromasts stained for otoferlin (green) under (D) control injected and (D’) morpholino injected conditions. Scale bars = 5 µm.

Figure Data
Acknowledgments
This image is the copyrighted work of the attributed author or publisher, and ZFIN has permission only to display this image to its users. Additional permissions should be obtained from the applicable author or publisher of the image. Full text @ Sci. Rep.