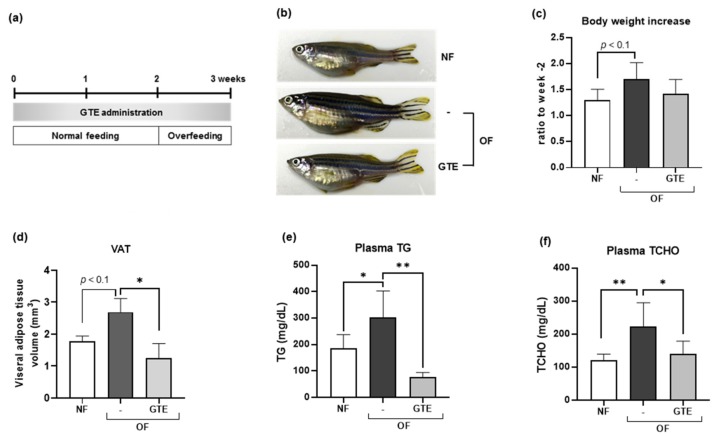
IMAGE

Figure 2

ID
ZDB-IMAGE-191230-527
Source
Figures for Zang et al., 2019
Image
Figure Caption

Figure 2

GTE reduced VAT and decreased plasma triglycerides (TG) and total cholesterol (TCHO) levels in adult obese zebrafish. (a) Diagram of the overfeeding experiment. GTE administration and overfeeding started on week 0 and week 2, respectively. (b) Typical images of normal-feeding (NF) and overfeeding (OF) zebrafish with or without GTE. (c) Change in body weight during the feeding experiment. (d) GTE reduced VAT in OF zebrafish. GTE suppressed the increase of plasma TG (e) and TCHO (f) in OF zebrafish. * p < 0.05, ** p < 0.01, n = 5, error bars indicate SD.

Figure Data
Acknowledgments
This image is the copyrighted work of the attributed author or publisher, and ZFIN has permission only to display this image to its users. Additional permissions should be obtained from the applicable author or publisher of the image. Full text @ Molecules