IMAGE

Figure 3

ID
ZDB-IMAGE-191230-1744
Source
Figures for Copmans et al., 2019
Image
Figure Caption

Figure 3

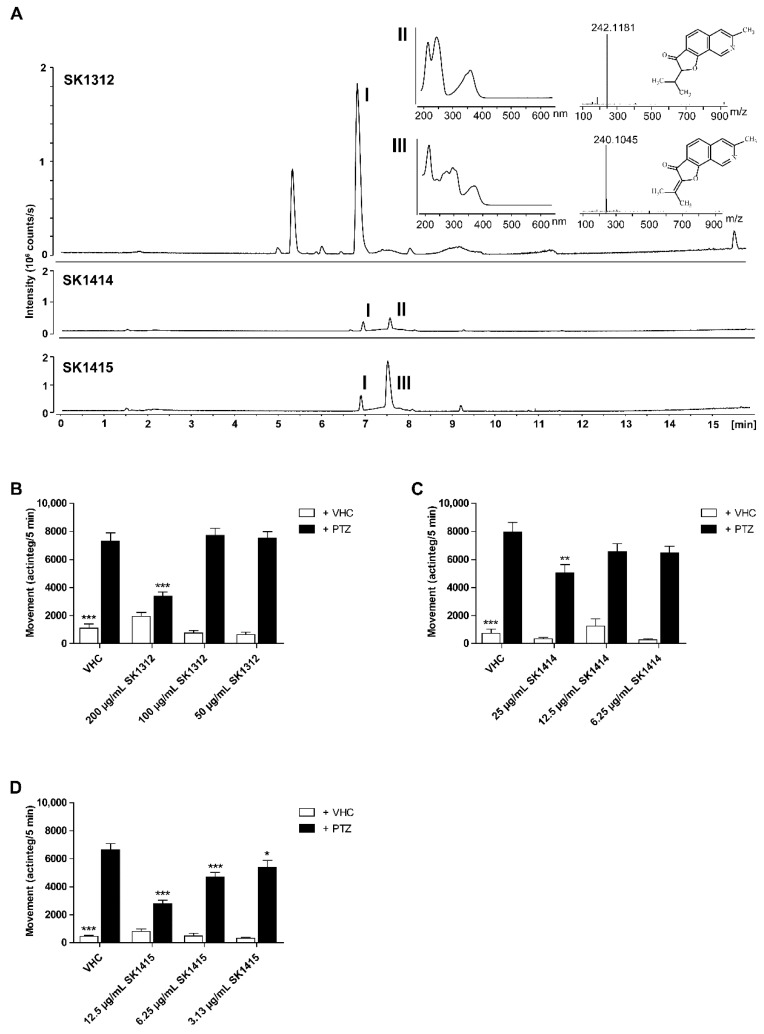
Bioactivity-guided identification of the active compounds of antiseizure hit SK0107. (A) Aspergillus insuetus IBT 28443 cultivated on czapek yeast extract agar (CYA) media for 9 days in the dark at 25 °C. Base peak chromatogram (BPC) of the most bioactive fraction (SK1312) from first reversed-phase fractionation in positive electrospray ionization mode (ESI+). ESI+ BPC chromatograms of the two most bioactive fractions (SK1414 and SK1415) from the second reversed-phase fractionation. UV/Vis and HRMS spectra for TMC-120A (II) and TMC-120B (III). (BD) Antiseizure activity of SK1312 (n = 23–24 replicate wells per condition) (B), SK1414 (n = 10–11 replicate wells per condition) (C), and SK1415 (n = 22 replicate wells per condition) (D) in the zebrafish pentylenetetrazole (PTZ) seizure model after 2 h of incubation at their maximum tolerated concentration (MTC), MTC/2, and MTC/4. PTZ- induced seizure-like behavior is expressed as mean actinteg units per 5 min (±SEM) during the 30-min recording period. (B,D) Data are pooled from two independent experiments with each 11–12 replicate wells per condition. (C) Data are from a single experiment with 10–11 replicate wells per condition. (BD) Statistical analysis: one-way ANOVA with Dunnett’s multiple comparison test for comparison of sample + PTZ groups with vehicle (VHC) + PTZ control group, Kruskal–Wallis test with Dunn’s multiple comparison test (data did not pass the Shapiro–Wilk normality test) for comparison of sample + VHC groups with VHC + VHC control group (GraphPad Prism 5, San Diego, CA, USA). Significance levels: * p ≤ 0.05; ** p ≤ 0.01; *** p ≤ 0.001.

Acknowledgments
This image is the copyrighted work of the attributed author or publisher, and ZFIN has permission only to display this image to its users. Additional permissions should be obtained from the applicable author or publisher of the image. Full text @ Mar. Drugs