
|
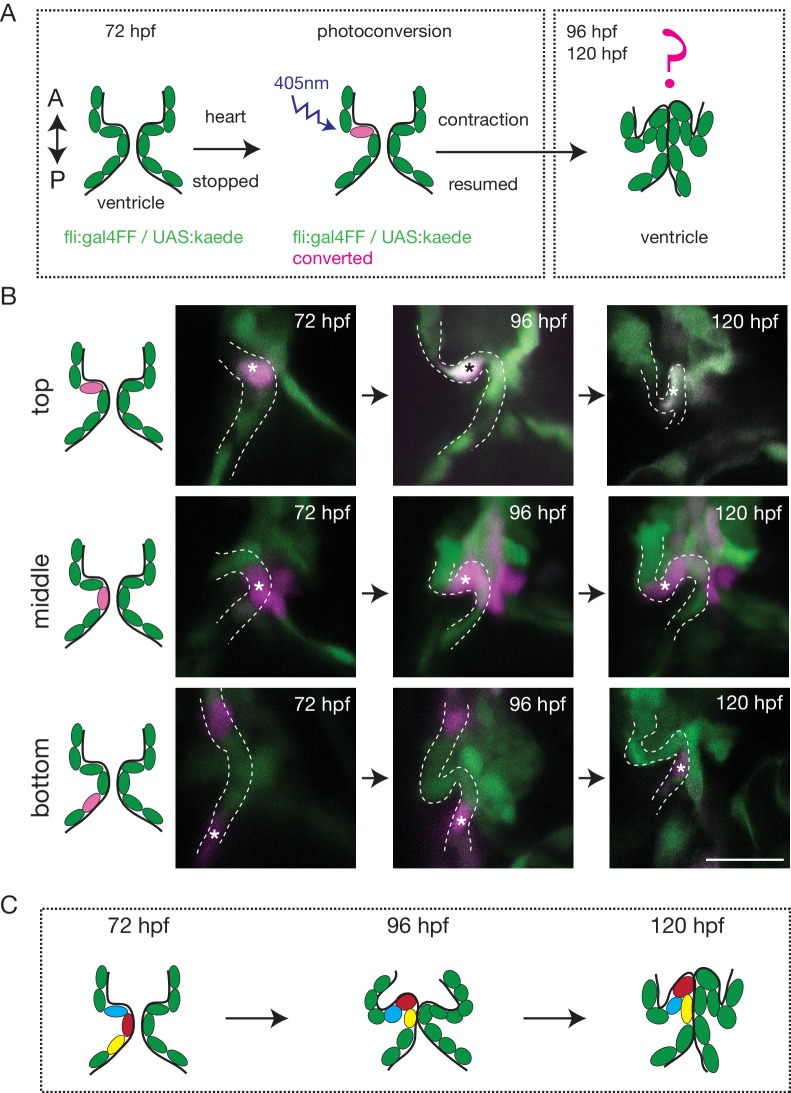
Figure 2 The endothelium contribution to emerging OFT valve leaflets. (A) Experimental set-up for the photoconversion studies. Heart was stopped at 72 hpf, the region of interest exposed to 405 nm light to convert kaede from green to red (shown in magenta) fluorescent form and heart contraction was resumed until 120 hpf. Beating hearts were imaged at 96 hpf and 120 hpf by spinning disk microscopy. A. Anterior, P. Posterior. (B) Z-sections of the Tg(fli:gal4FF; UAS:Kaede) line just after photoconversion (72 hpf), and at 96 hpf and 120 hpf. The star highlights the photoconverted cell in the top (n = 6), middle (n = 5) and bottom (n = 4) part of the OFT valve. The other photoconverted cell anteriorly goes out of the frame. Scale bar: 20 µm. Results obtained from three independent experiments. (C) Schematic representation of the results of the photoconversion studies showing the folding of the endothelium in the OFT.