IMAGE

Fig 4

ID
ZDB-IMAGE-191230-1162
Source
Figures for Watterston et al., 2019
Image
Figure Caption

Fig 4 Increased levels of <italic>smad1</italic> result in defects in the vascular system and body axis.

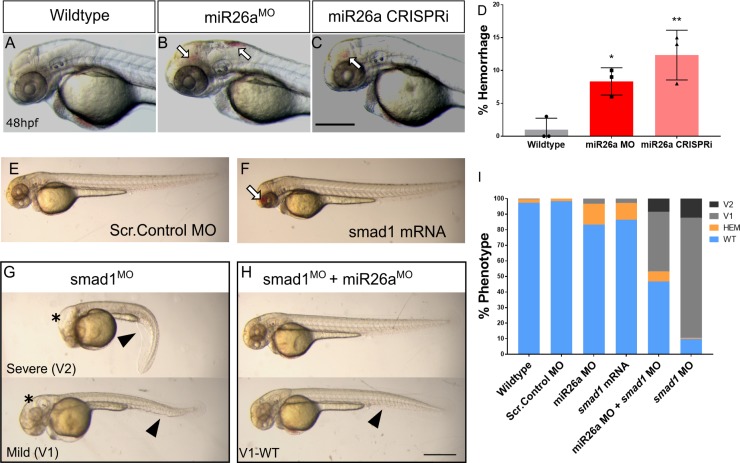
A-C) Representative 48 hpf miR26a knockdown embryos with hemorrhage, as indicated by arrows. D) Quantification of average rates of hemorrhage. (Error bars = SD Unpaired t test, miR26a MO *p< 0.01 and mi26 CRISPRi **p< 0.001 as compared to WT, N = 3, Wildtype n = 224, miR26a MO n = 124, miR26a CRISPRi n = 180). E-F) Representative morphology after smad1 overexpression. G-I) miR26a and smad1 double knockdown experiments. G) Representative 48 hpf smad1 MO embryos with mild (V1) and severe (V2) ventralization phenotypes. H) Representative 48 hpf double miR26a and smad1 knockdown embryos with rescued hemorrhage and normal body axis showing only mild (V1-WT) ventralization phenotypes. I) Quantification of observed phenotypes double knockdown experiments (N = 4, total n wildtype = 193, Scr. Control MO = 157, smad1 MO = 175, smad1 mRNA = 95, miR26a MO = 190, and miR26a MO + smad1 MO = 190. One Way ANOVA of hemorrhage phenotype; Wildtype/Scr. Control MO vs. miR26a MO p< 0.0001 Wildtype/Scr. Control vs. SMAD1 mRNA p< 0.0001 miR26a MO vs. miR26a MO+ smad1 MO p< 0.0001 One Way ANOVA of V1 phenotype: Wildtype/Scr. Control MO; vs. smad1 MO p< 0.0001 vs. miR26a MO+ smad1 MO p< 0.0001. Error Bars = SEM. Scale bar represents 500μm.

Figure Data
Acknowledgments
This image is the copyrighted work of the attributed author or publisher, and ZFIN has permission only to display this image to its users. Additional permissions should be obtained from the applicable author or publisher of the image. Full text @ PLoS Genet.