IMAGE

Fig. 5

ID
ZDB-IMAGE-191230-1012
Source
Figures for Ayala-Nunez et al., 2019
Image
Figure Caption

Fig. 5

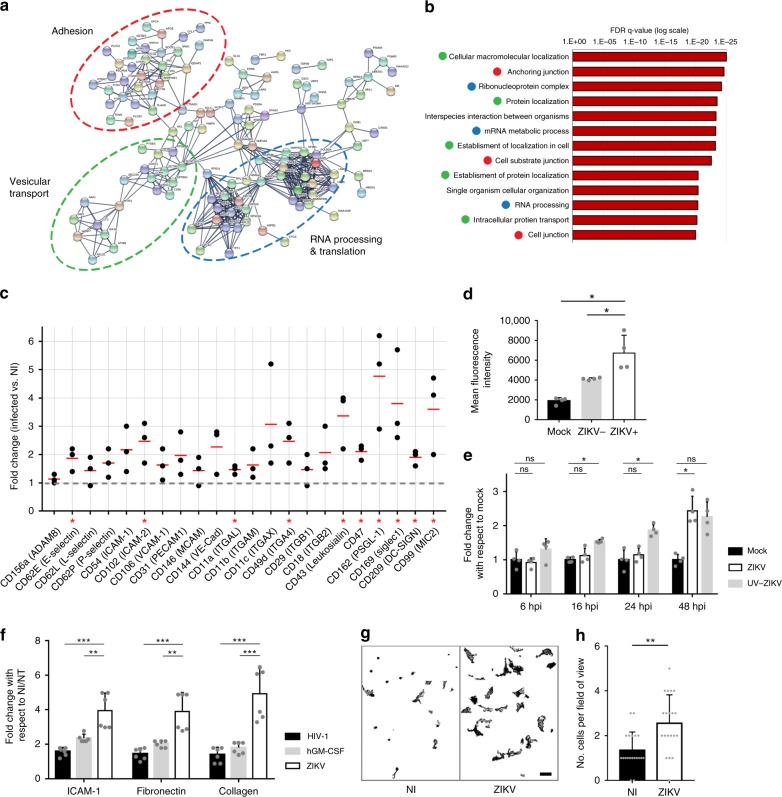
ZIKV-exposed monocytes exhibit higher adhesion properties. a, b Monocytes from two donors were infected with ZIKV. At 48 hpi, the cells were processed for quantitative proteome profiling by using liquid chromatography coupled to tandem mass spectrometry (LC–MS/MS). Cluster and ontology analyses of the upregulated proteins (virus over mock) were identified by using STRING (a) and GSEA (b) methods. The list of the proteins modulated upon ZIKV infection by using a 5% FDR (p value < 0.0085) is provided in Supplementary Data 1. c Flow cytometry analysis assessing the surface expression of 22 adhesion molecules upon ZIKV infection. Each dot corresponds to the average fold change of duplicates for individual donors. The red lines correspond to the mean from three donors. The gray dashed line indicates a fold change of 1 (no differential expression between infected and noninfected monocytes). d The expression of CD99 (MIC2) was measured in monocytes from two donors treated with mock or ZIKV for 48 h. In the latter, the CD99 expression was quantified within the noninfected (ZIKV–) and the infected (ZIKV+) populations. e Expression of CD99 was measured over time on monocytes from two donors treated with mock, ZIKV, and UV-inactivated ZIKV. The bar graphs show the fold change of CD99 expression with respect to mock (mean ± SD). f Noninfected/nontreated (NI/NT), hGM-CSF-treated, ZIKV-, or HIV-infected monocytes were plated in wells coated with collagen, ICAM-1 protein, or fibronectin. The relative number of cells was measured by using CellTiter-Glo. Each bar graph corresponds to an experiment performed on monocytes from two healthy donors showing the mean ± SD from two individual experiments. g, h ZIKV-infected or NI monocytes of two donors were cocultured with hCMEC/D3 cells grown on glass coverslips. Upon fixation and staining with an anti-CD45 antibody, the number of adherent monocytes was quantified by confocal microscopy (g and Supplementary Fig. 9a, b). Scale bar: 20 µm. h The bar graph corresponds to the mean ± SD of the number of monocytes counted per ten fields of view from two individual experiments for two donors. Two-tailed p value was nonsignificant (ns), <0.05 (*), <0.005 (**), or <0.0005 (***). Statistical significance was determined by using a t test. NI noninfected, NT no cytokine treatment. Source data in bf, h are provided as a Source Data file

Acknowledgments
This image is the copyrighted work of the attributed author or publisher, and ZFIN has permission only to display this image to its users. Additional permissions should be obtained from the applicable author or publisher of the image. Full text @ Nat. Commun.