
|
Fig. 3-S2
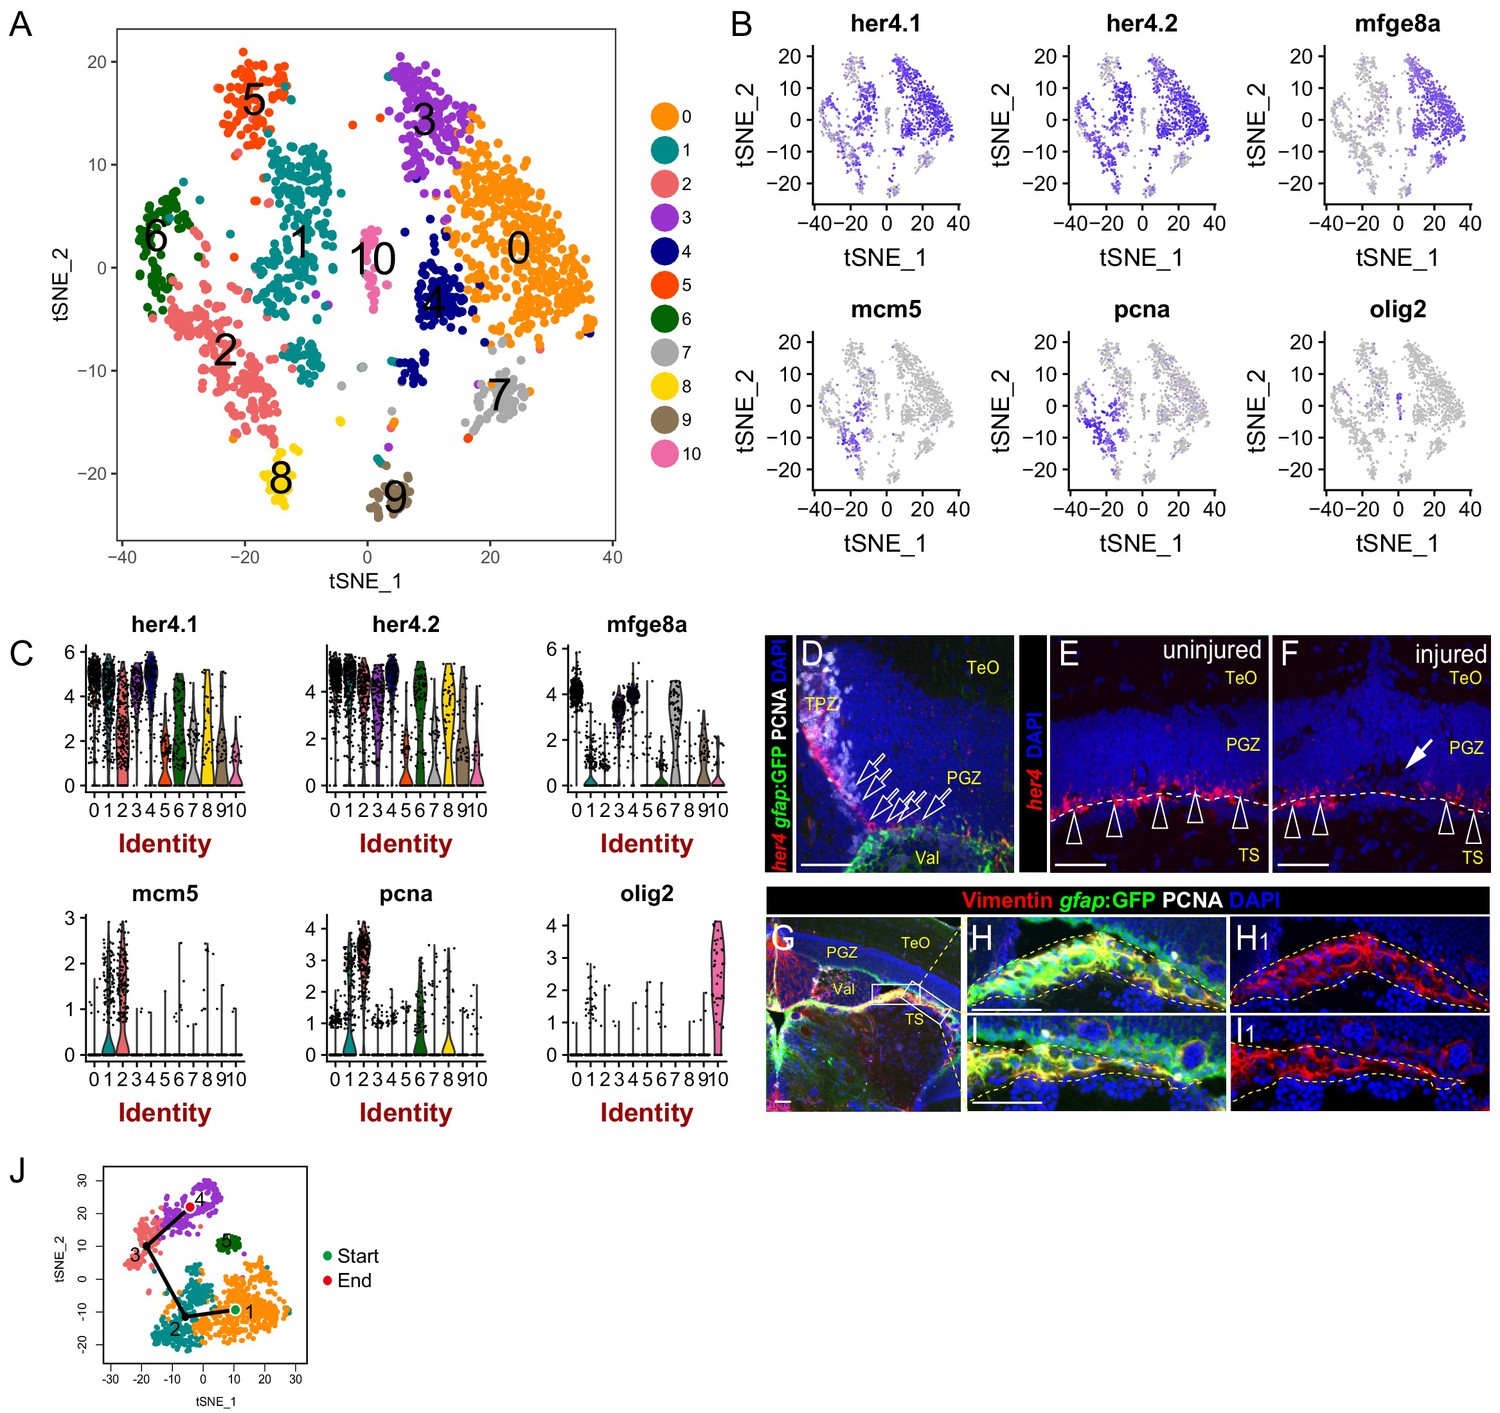
Identification of the clusters representing RG in the TPZ and oligodendrocytes.
(A) t-SNE plot of 1604 glial cells revealing 11 cell clusters. (B) t-SNE plots showing the expression pattern of 6 genes utilized to identify the cluster consists of RG from TPZ (cluster 1) and oligodendrocytes (cluster 10). (C) Violin plots of expression of 6 genes shown in (B). (D–F) In situ hybridization showing her4 mRNA is highly expressed in RG from TPZ (open white arrows in (D)) and dormant RG (open white arrowheads in (E and F)) in central-dorsal region of optic tectum, whereas its expression is down-regulated in RG underneath the injury site ((F), white arrow). White dashed lines represent the tectal ventricle boundary. (G–I1) Representative images of Tg(gfap:GFP) (green), Vimentin (red) and PCNA (white) immunofluorescences showing the RG in the neighboring brain tissues (yellow dashed lines in H-I1) under the PGZ in the midbrain are GFP+/Vimentin+/PCNA−. These cells are likely to cause contamination (cluster 5 in Figure 3B) during the dissection of the optic tecta. (J) Pseudo-time developmental trajectory of identified states using Slingshot showing that the trajectory is booted from dRG cluster (cluster 1) and end at pRG-G2 cluster (cluster 4). RG, radial glia; TeO, tectal opticum; PGZ, periventricular gray zone; TS, torus semicircularis; Val, valvula cerebelli.