
|
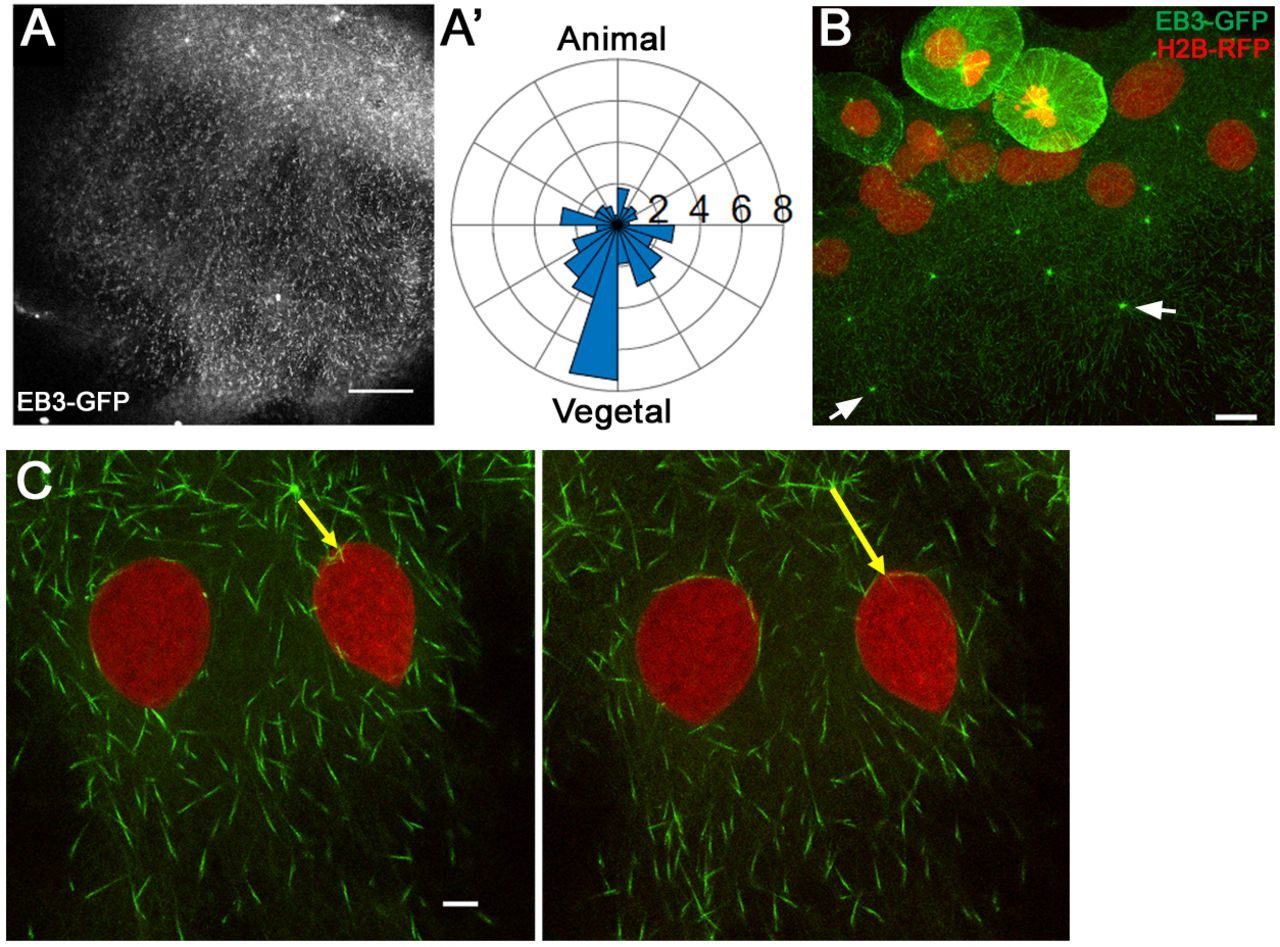
Fig. 4
E-YSN migrate away from MTOCs. (A-A′) PIV analysis of EB3-GFP fluorescent comet flow. Single-plane time-lapse movie analyzed; blastoderm is at the top right (A). Combined rose plot of PIV vector angles from five confocal time-lapse movies of embryos expressing EB3-GFP (A′). PIV vectors were averaged over 30 s. Radial axis (×105) indicates the number of vectors from all movies in each bin. (B,C) Lateral views of confocal projections of embryos expressing H2B-RFP and EB3-GFP. Vegetally positioned MTOCs in the YSL indicated with white arrows. n=9 (B). Two e-YSN migrating away from the MTOC indicated by the yellow arrow. n=6 (C). Scale bars: 50 µm in A; 20 µm in B; 5 µm in C.