
Image
|
Figure Caption
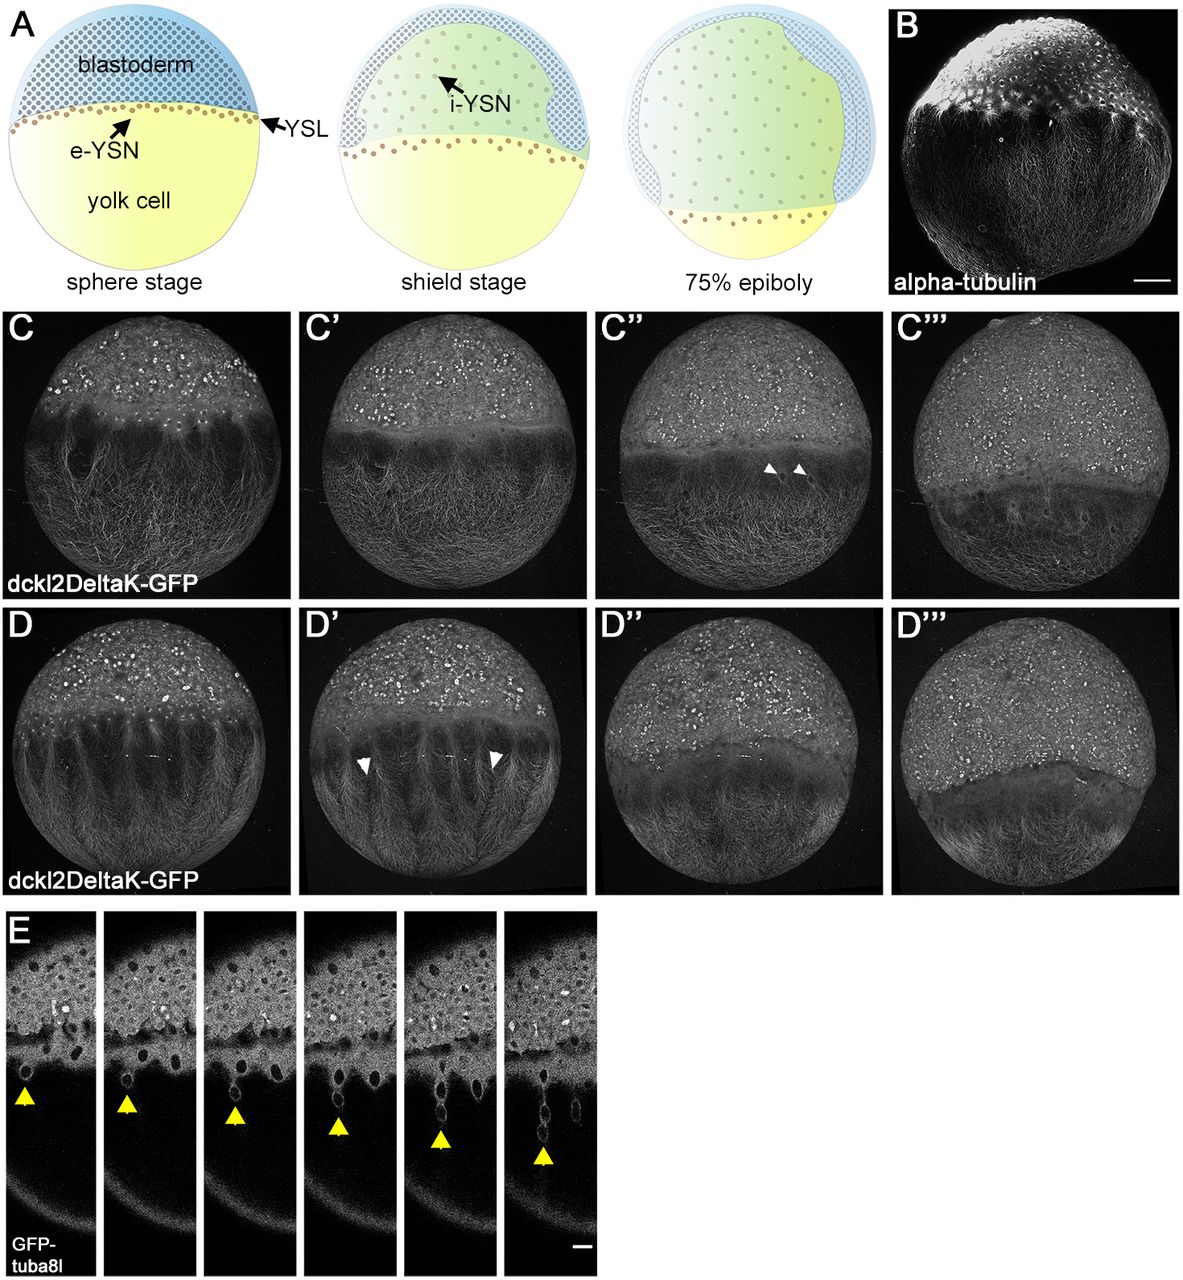
Fig. 1
Yolk cell microtubule dynamics during epiboly. Panels are lateral views with the animal pole to the top. (A) Embryo schematics during epiboly. (B) Alpha-tubulin antibody staining of sphere-stage embryo. (C-D‴) Live confocal projections of 2 Tg:(XlEef1a1:dclk2DeltaK-GFP) embryos from early to late epiboly (left to right). In C″ arrowheads indicate migrating e-YSN. In D′ arrowheads indicate gaps between microtubule branches. (E) Stills from confocal time-lapse of a Tg:(XlEefla1:GFP-tuba81) embryo during mid-epiboly. Arrowheads indicate migrating e-YSN forming a chain. Scale bars: 100 µm in B-D‴; 25 µm in E.
Acknowledgments
This image is the copyrighted work of the attributed author or publisher, and
ZFIN has permission only to display this image to its users.
Additional permissions should be obtained from the applicable author or publisher of the image.
Full text @ Development